Debugging
There are extensive instructions on debugging Arm Mbed OS 5 applications with uVision 5, Eclipse and Visual Studio Code, but you can use any IDE that supports GDB to debug Mbed OS 5 applications. This document gives advice on how to configure these IDEs. Before starting, first configure your local debug toolchain.
Exporting your project
Although you can use our tools to generate project files specific to many IDEs, you can also use our tools to generate Makefiles. Almost any C/C++ IDE can use Makefiles to build your project. To generate a Makefile, you can use either the Arm Mbed Online Compiler or Arm Mbed CLI.
Online Compiler
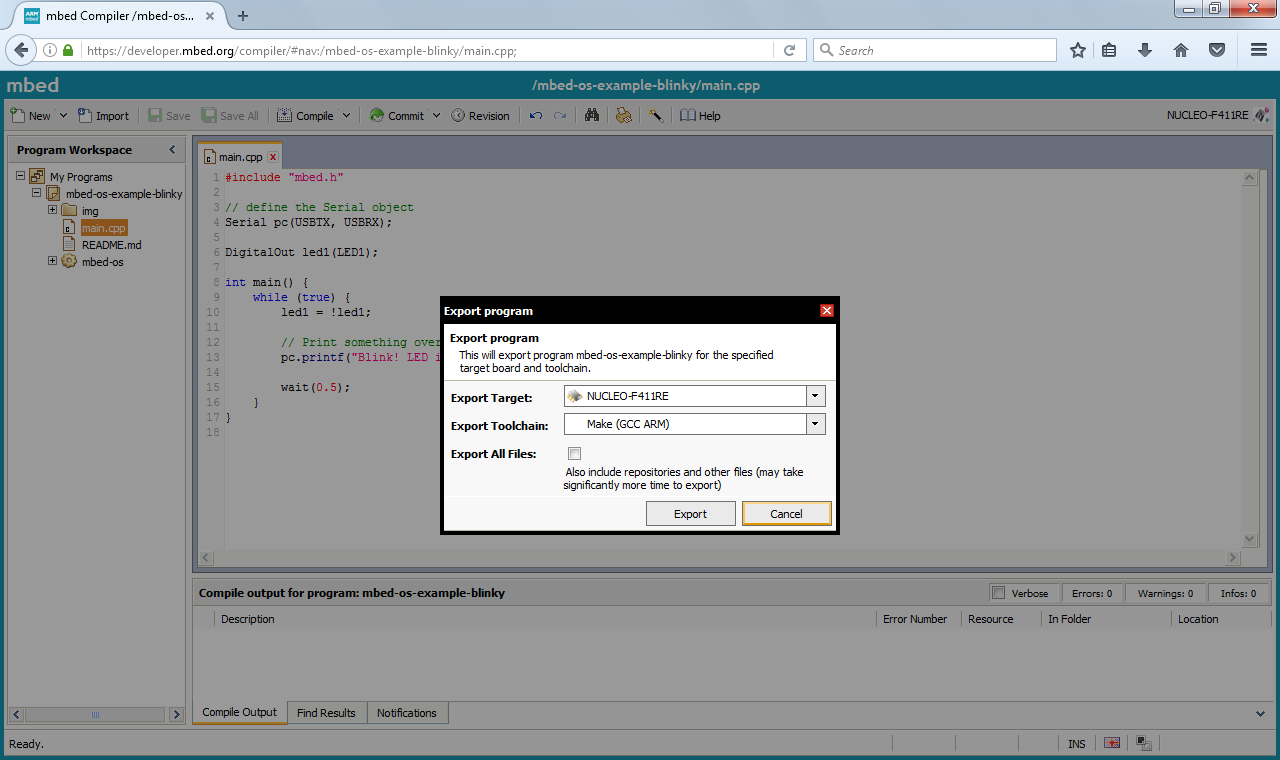
- Right click on your project.
- Select Export Program....
- Under 'Export toolchain', select Make (GCC ARM).
- For most targets you can also export to IAR or ARMCC.
- Click Export, and unpack at a convenient location.
Mbed CLI
In your project folder, run:
# alternatively, use -i make_armc5 for ARMCC, or -i make_iar for IAR
# replace K64F with your target board

$ mbed export -i make_gcc_arm -m K64F
Serial terminal
You can open a serial terminal to the COM port of a connected Mbed target (usually board) using the mbed sterm command. If no COM port is specified, Mbed CLI detects the connected Mbed targets and their COM ports.
There are various options to mbed sterm:
--port <COM port>to specify system COM port to connect to.--baudrate <numeric>to select the communication baudrate, where the default value is 9600.--echo <on|off>to switch local echo (default ison).--resetto reset the connected target by sending Break before opening the serial terminal.
You can also set default port, baudrate and echo mode using the TERM_PORT, TERM_BAUDRATE and TERM_ECHO Mbed CLI configuration options.
The following shortcuts are available within the serial terminal:
- Ctrl+b - Send Break (reset target).
- Ctrl+c - Exit terminal.
- Ctrl+e - Toggle local echo.
- Ctrl+h - Help.
- Ctrl+t - Menu escape key.
- You can view more shortcuts within the serial terminal's help menu (Ctrl+h).
You can also add the --sterm option to mbed compile -f to compile a new program, flash the program or firmware image to the connected target and then open the serial terminal to its COM port:
$ mbed compile -t GCC_ARM -m K64F -f --sterm
Building your project
You can now configure your IDE to build this project by setting the build command to:
make -j
The resulting binary will end up at BUILD\projectname.elf.
Debugging your project
To debug your project, you first need to start a debug server. This is often exposed as a setting in your IDE under 'Remote debugging' or 'Debug server'.
- When using pyOCD, set the full path to the
pyocd-gdbserverbinary, and do not set arguments. - When using OpenOCD, set the full path to the
openocdbinary, and set the arguments for your development board. (See the instructions.)
Next, you need to configure GDB.
-
Set the program to be debugged to the location of the
.elffile. -
Set the remote target to
localhost:3333. -
Set the following options as 'set up commands' (to execute right after the connection to GDB):
-target-select remote localhost:3333
-file-exec-and-symbols YOUR_PROJECT_ROOT\BUILD\projectname.elf"
-interpreter-exec console "monitor reset"
-interpreter-exec console "monitor halt"
-interpreter-exec console "monitor arm semihosting enable"
-target-download
Make sure to update the path on line 2 to your
.elffile.
This starts a debug server, attaches GDB to your development board, flashes the binary using GDB and starts a debug session.