Debugging with Mbed Studio
The section below explains how to do debugging with development boards that are automatically detected and configured. If you are using a debug probe, or want to use configuration from a CMSIS-Pack, please set up a custom target first.
Overview
This section presents the debugger mode and debugging tools available in Mbed Studio. You can step debug an Mbed program on any connected Mbed Enabled board that supports pyOCD. The debugger mode provides different ways of checking what your code is doing while it runs. You can step through your code, examine the execution path of your code, or look at the values stored in variables and more!
First steps
To start debugging:
-
Set the program you want to debug as the active program.
-
Connect a board to your computer with a USB adapter and ensure it is the build target for your program (Mbed Studio should automatically detect the connected board).
-
Select the Debug build profile.
-
Click the debug icon
 .
.Mbed Studio automatically builds and flashes your program to the connected board.
The Debug view is displayed and the debug session is started.
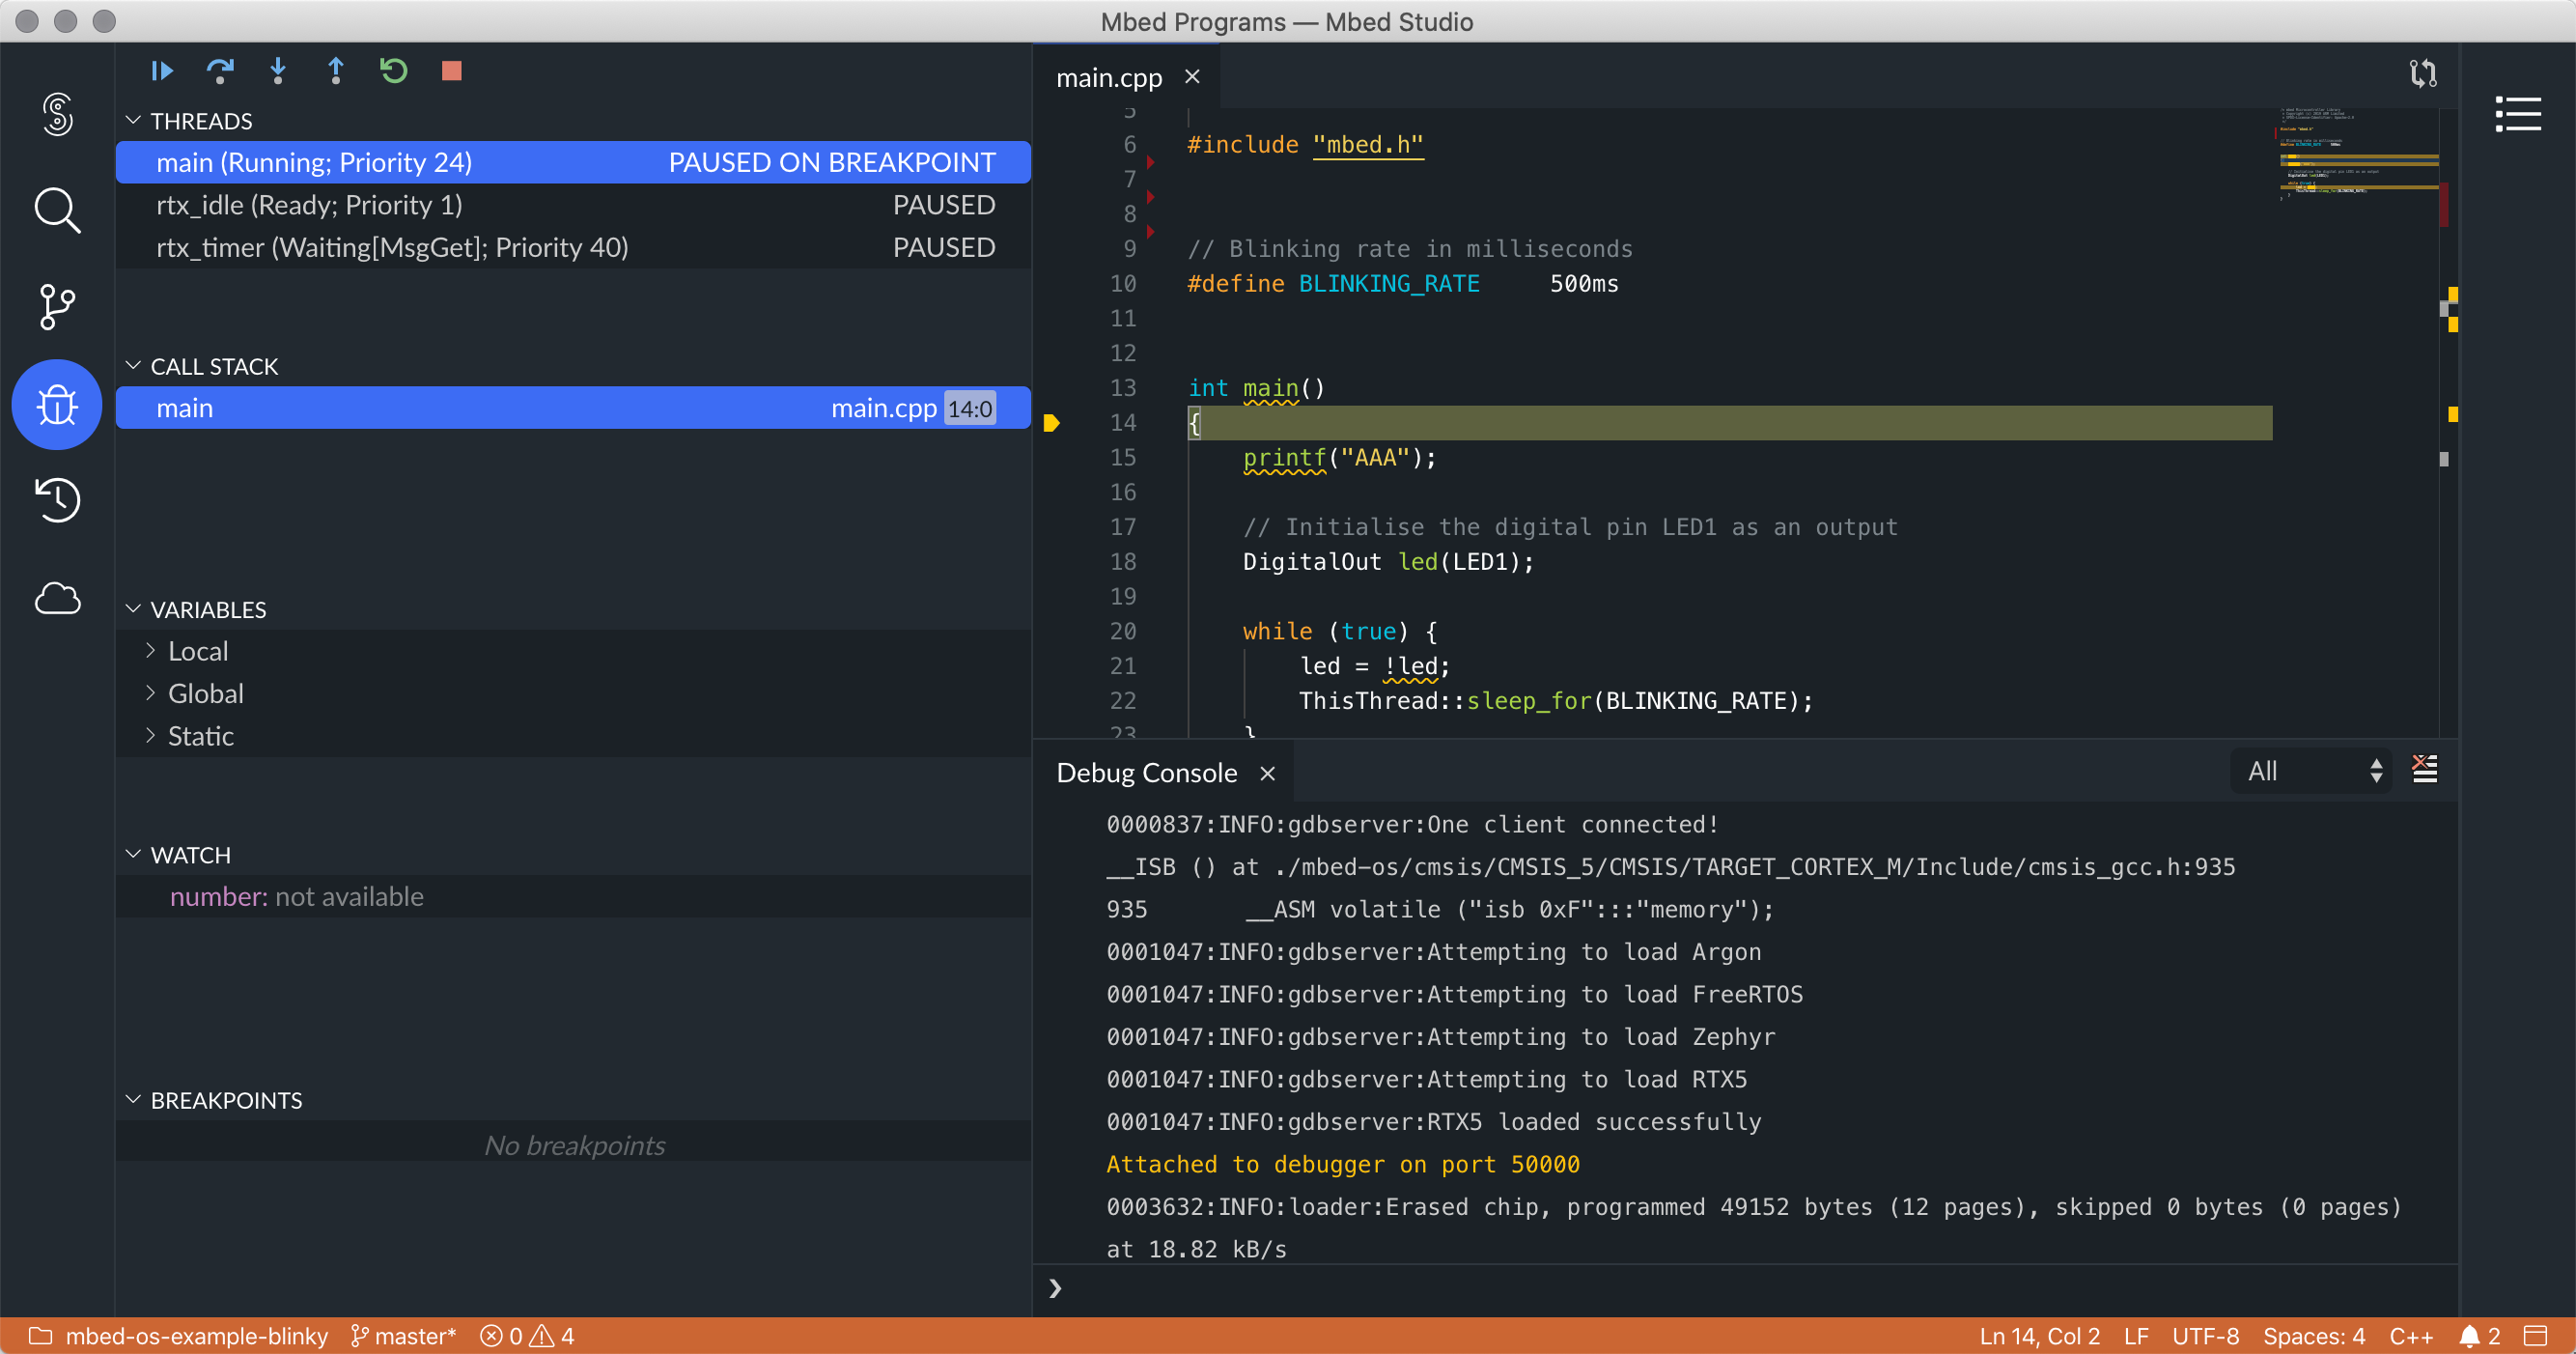 Setting up a debug session.
Restarting or stopping the debugger
When you click the Restart button ![]() , the debugger starts debugging the code from the beginning. This is faster than stopping the debugger and initiating a new debug session from the Explorer view.
, the debugger starts debugging the code from the beginning. This is faster than stopping the debugger and initiating a new debug session from the Explorer view.
If you do want to stop the debugger and get back into the editor, click the Stop button ![]() .
.
Using the step buttons to navigate your code
There are several options available to help you navigate your code more quickly:
- Step Over
 : Skip over functions or methods and go straight to the parts of code you are more interested in.
 - Step Into
 : Advance the debugger into each function. The debugger then breaks on the first statement that gets executed in the function.
 - Step Out
 : Advance the debugger until the current function returns (in other words, advance all the way through the current function).
Setting breakpoints
Breakpoints are useful when you know which part of your code needs to be examined. You can set one or more breakpoints to suspend your running code in order to take a look at variables' values, or see whether or not a block of code is getting executed.
Tip: By default, Mbed Studio stops on the first line of main(). You can change this in File > Settings > Open Preferences > Debug > Run To Main (clear the checkbox).
To set a breakpoint, click in the margin to the left of a line of code in the editor. A red dot is displayed. You can also right-click in the margin and select Add Breakpoint.
Click the Continue button to start debugging ![]() . The debugger runs to the first breakpoint it encounters and stops. A yellow arrow is displayed next to the statement on which the debugger paused. The statement is highlighted in yellow.
. The debugger runs to the first breakpoint it encounters and stops. A yellow arrow is displayed next to the statement on which the debugger paused. The statement is highlighted in yellow.
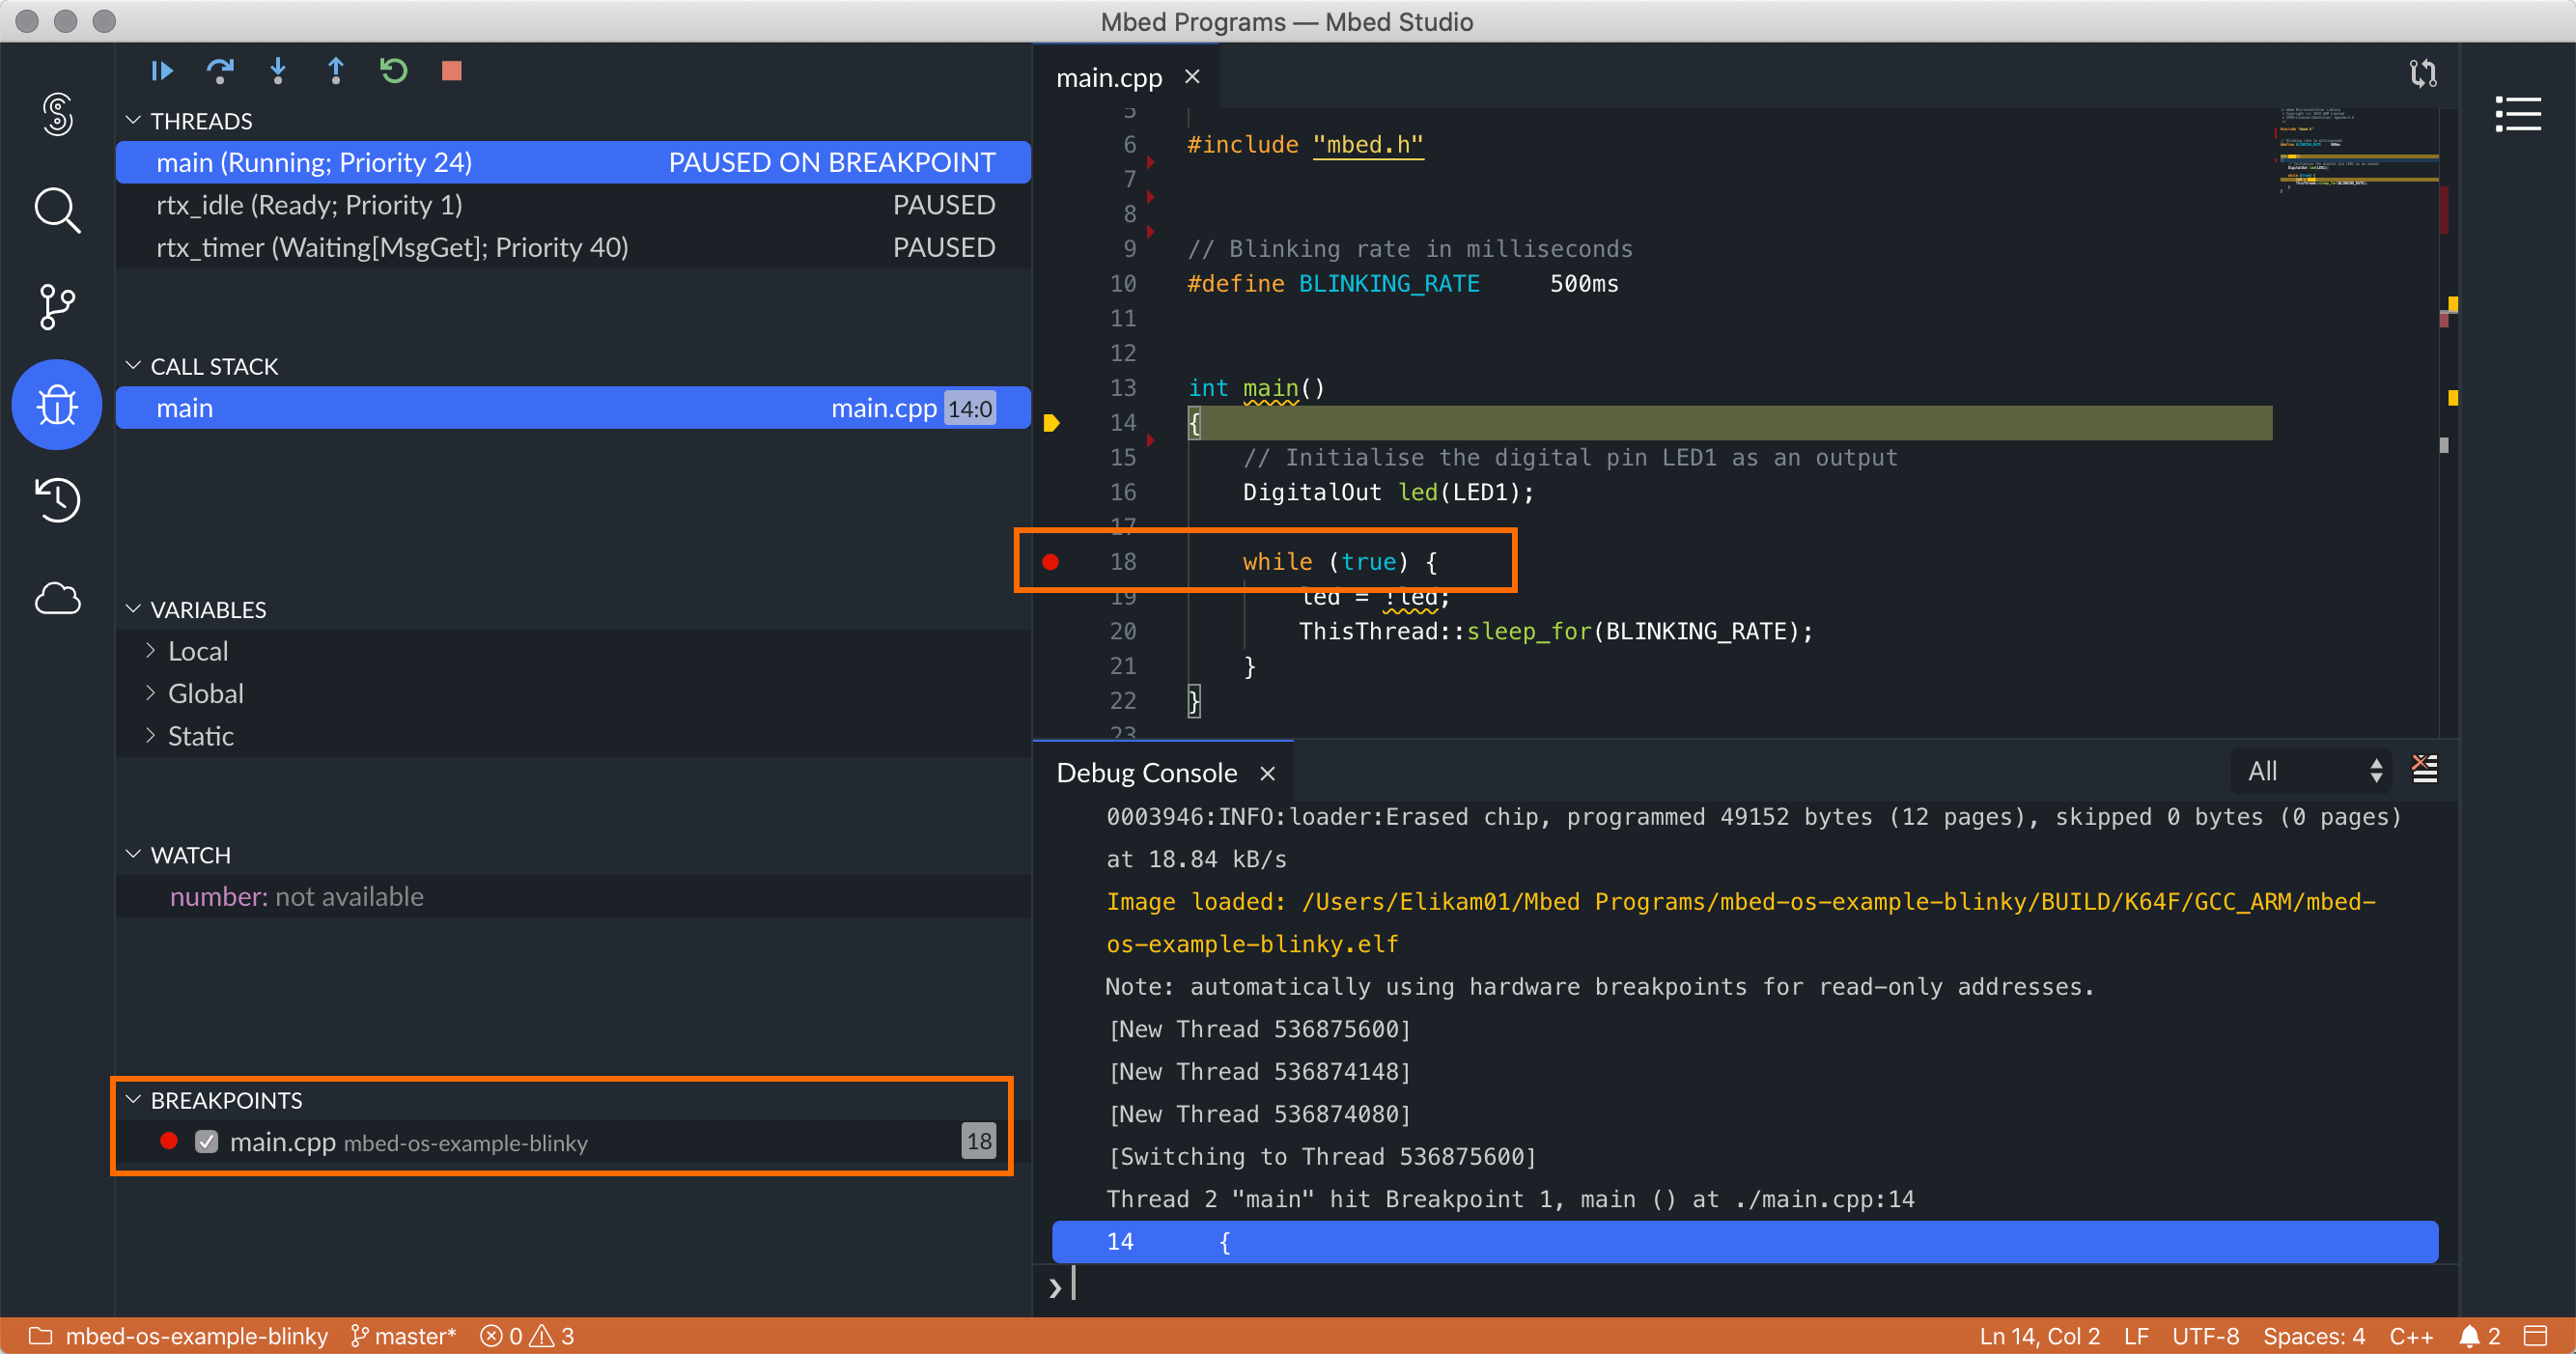 Debug session with breakpoint on line 18.
Once you have set a breakpoint, you can remove it, edit it, or disable and enable it again. Right-click the breakpoint and select Remove Breakpoint, Edit Breakpoint... or Disable Breakpoint (or Enable Breakpoint if the breakpoint is disabled). You can also remove a breakpoint by simply clicking it in the margin.
More options are available from the BREAKPOINTS list to remove, edit or disable and enable breakpoints:
- Activate/Deactivate Breakpoints
 : Enable or disable all breakpoints at once.
 - Remove All Breakpoints
 : Remove all breakpoints at once.
 - When you right-click a breakpoint from the list, the following options are available: Edit Breakpoint..., Remove Breakpoint, Remove All Breakpoints, Enable All Breakpoints, Disable All Breakpoints.
- You can disable or enable a breakpoint by selecting the checkbox next to it in the list.
The Edit Breakpoint... option allows you to set conditional breakpoints and logpoints. See below for more details.
Setting conditional breakpoints and logpoints
Conditional breakpoints
Conditional breakpoints allow you to break inside a code block when a defined condition is met.
You can set two types of conditions:
- Conditional expression: The debugger pauses when the expression you defined is true.
- Hit count: The debugger pauses after a specified number of hits, called a hit count. If you suspect that a loop in your code starts misbehaving after a certain number of iterations, you can set a breakpoint to stop execution after that number of hits.
To set a conditional breakpoint:
-
Right-click in the margin to the left of a line of code in the editor and select Add Conditional Breakpoint....
If you already have a breakpoint defined, you can also right-click the breakpoint and select Edit Breakpoint....
-
In the drop-down list that is displayed, select Expression or Hit Count and set a condition as follows:
- Expression: Can be any valid expression that the debugger recognizes. The debugger pauses when the expression is satisfied.
- Hit Count: Specify the number of iterations (hits) after which execution will stop.
-
You can optionally add a message that will be logged in the Debug Console view when the condition you defined is met. In the drop-down list, select Log Message and write a message in the field. You can use expressions in your message if they are between curly brackets
{}. -
Press Enter.
As described for breakpoints, options are available to remove, edit or disable and enable conditional breakpoints.
 Debug session with an expression and log message.
Logpoints
Logpoints allow you to display messages in the Debug Console view when the debugger hits them.
Note: Note that the debugger does not break on logpoints.
To set a logpoint:
-
Right-click in the margin to the left of a line of code and select Add Logpoint....
-
Write a message in the Log Message field. You can use expressions in your message if they are between curly brackets
{}. -
Press Enter.
Options are available to remove, edit or disable and enable logpoints. Right-click the logpoint and select Remove Logpoint, Edit Logpoint... or Disable Logpoint (or Enable Logpoint if the logpoint is disabled). You can also remove a logpoint by simply clicking it in the margin.
See also the options available from the BREAKPOINTS list.
Setting function breakpoints
With function breakpoints, you can break execution when a function is called. This is useful, for example, when you know the function name but not its location. It is also useful if you have functions with the same name and you want to break on them all (such as overloaded functions or functions in different projects).
To set a function breakpoint:
-
Click the Add Function Breakpoint button
 in the BREAKPOINTS list.
The Add Function Breakpoint dialog box opens.
-
Type the name of the function you are looking for and click OK.
 Debug session with a function breakpoint.
Setting watch expressions
If you want to keep track of some variable or the result of a more complex expression, you can set up a watch for this variable or expression. This is useful when you need to add something that is not regularly displayed on the list of variables.
To set a watch expression:
-
Click the Add Expression button
in the WATCH list.The Edit Watch Expression dialog box opens.
-
Type the name of a variable or expression and click OK.
More options are available from the WATCH list:
- Collapse All
 : Collapse the list of expressions.
 - Remove All Expressions : Remove all expressions at once.
- When you right-click a watch expression from the list, the following options are available: Edit Expression, Copy Value, Remove Expression, Remove All Expressions.
 Debug session with a watch expression.
Examining threads and call stacks
You can examine and work with threads in the code that you are debugging. Working with threads is useful for debugging multithreaded applications. Each thread appears on a separate row in the THREADS list and has its own call stack.
When using the Mbed OS full profile, you'll see several active threads in the THREADS list, including the threads running Mbed OS system services. You may also see other drivers, such as networking drivers, spin their own threads. See Threads for more details. Note that the bare metal profile, contrary to the Mbed OS full profile, does not include a real time operating system (RTOS) or threading capabilities.
When you select a thread, its call stack is displayed in the CALL STACK list. The call stack shows the order in which methods and functions are called. The call stack is a good way to examine and understand the execution flow of your code.
When you right-click a thread from the THREADS list, the following options are available:
- When the debugger is paused, you can click Continue, Step Over, Step Into or Step Out to navigate the code.
- When the debugger is running, you can click Pause to pause the debugger.
When you right-click a call stack from the CALL STACK list, the following options are available:
- Restart Frame: Allows you to restart the current stack frame. With this option you can re-run the preceding code after hitting a breakpoint.
- Copy Call Stack: Allows you to copy a call stack to the clipboard to further investigate a problem.
Inspecting variables
You can inspect variables and check whether they are storing the values they should contain. If you find a wrong value, find out where it was set (you might need to restart the debugger, look at the call stack or both).
Local, global and static variables are shown in the VARIABLES list.
When the debugger is paused, hover over an object with the mouse, and you will see its current property value. You can also view variable values in the VARIABLES list.
When the debugger is paused, several options are available when you right-click a variable from the VARIABLES list:
- Set Value: Allows you to overwrite the value of a variable.
- Copy Value: Allows you to copy the value of a variable.
- Copy As Expression: Allows you to copy the name of a variable.
Using GDB through the Debug Console view
If you are an advanced user, you can use the Debug Console view to interact with the debugger through GNU Debugger (GDB) commands.
To access the Debug Console view, open the View menu and select Debug Console (or press Ctrl+Shift+Y (Windows) or Cmd+Shift+Y (macOS)).
The Debug Console view provides functionality the UI does not expose, including the ability to inspect register values, break when a memory address is accessed and see where a variable is stored in memory.
For example, to view the contents of all registers while debugging:
-
Wait for your program to stop at a breakpoint.
-
Open the Debug Console view.
-
In the Debug Console view, type:
info registers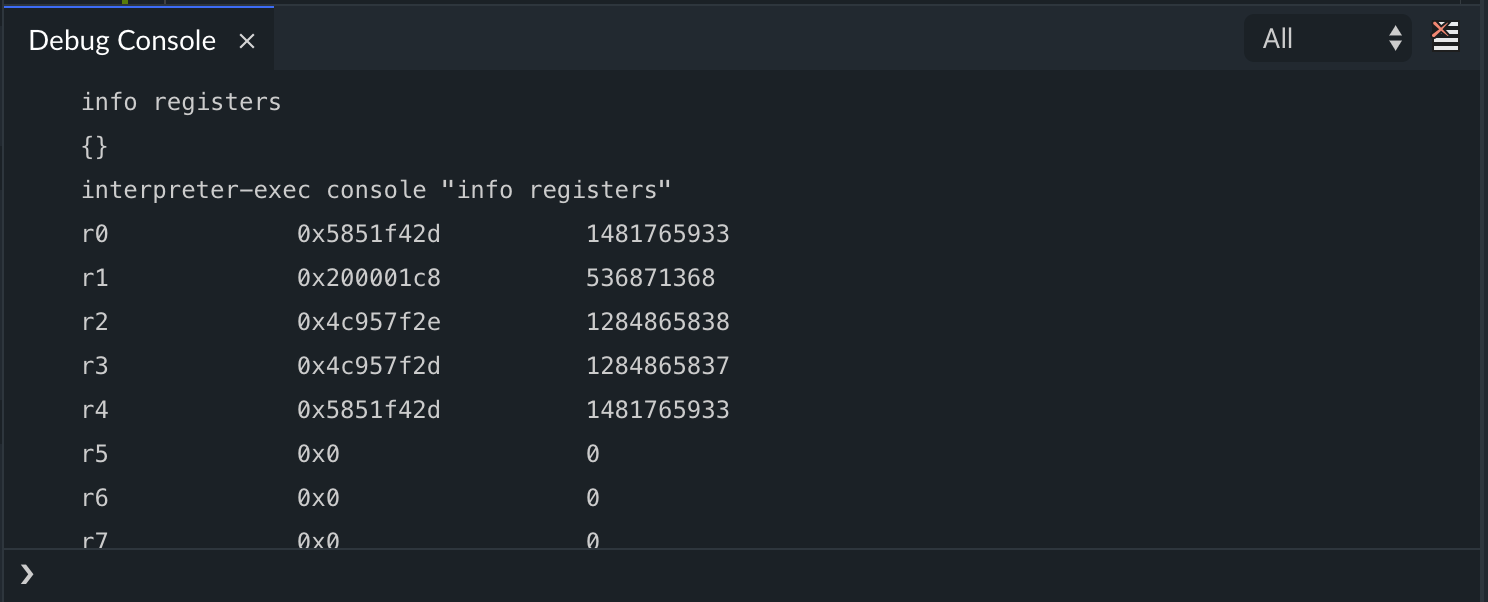 The
The info registerscommand prints the information saved in all general-purpose CPU registers.
For more details about all of the GDB commands you can use, see the GDB Command Reference.