You are viewing an older revision! See the latest version
IOT
The Internet of Things demo
Intro
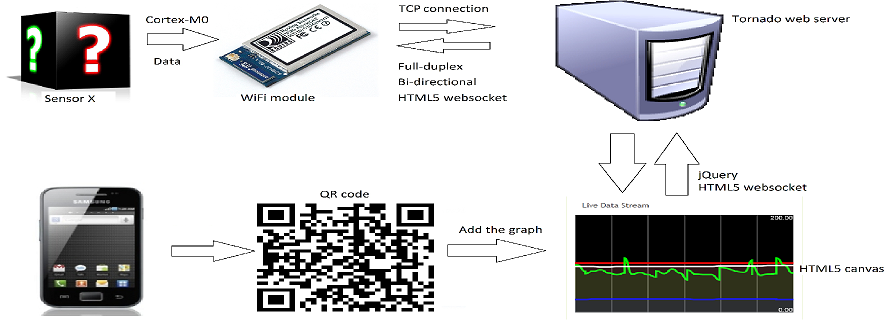
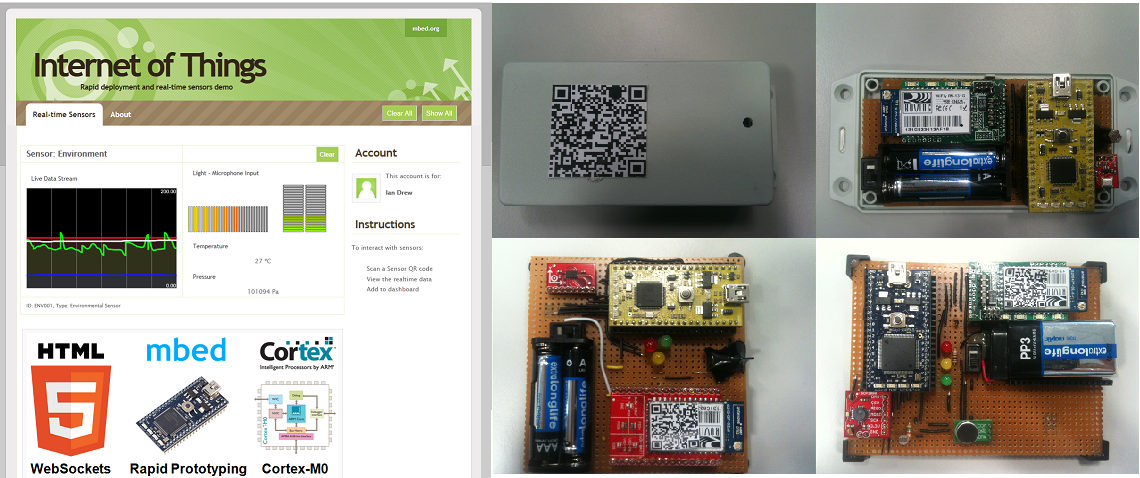
This project was to give a suitable demonstration of the 'internet of things' - representing data about real world objects in an internet-like structure - using an mbed, WiFi and WebSockets. The demo was to have real time data about one or more objects accessible through the internet. We simulated an application of the IOT, scanning QR codes with a phone to take us to a dashboard to view the data.
For more on WebSockets, please see Websockets.
To give WebSockets a go, please see Websockets and you:Upcoming web technologies
To reproduce this project please see Websockets Server.

Process
Software
The mbed, after establishing a connection to the server, processes and streams data on its sensors using HTML5 WebSockets. Multiple streams like this can be open at once, and the data is broadcast by the server to every connected device using a WebSocket connection. The webpage we view the data on (also using WebSockets) filters the broadcasted data from the server for what is desired, and using jQuery displays or hides it using the HTML5 canvas element. This means the server can treat all its clients the same, merely broadcasting any data it receives to all the clients. //
Hardware
We chose to use WiFi for the demo. For this, we used a WiFi module produced by Roving Networks. We used an mbed with an ARM Cortex-M0 processor for low power consumption, as our demo was fully wireless. We used standard sensors in mbed kits so we could utilize the libraries already written for them. Note that the hardware is irrelevant; any device with an internet connection and the right capabilities could replicate this demo.
Application
The idea behind the demo is that the time between receiving the sensor and seeing the data online is as short and easy as possible. To achieve this, we used QR codes to speed up the whole process. The final demo consisted of the following steps:
- Place the object where desired (so light sensor on a wall)
- Scan the QR code on the sensor with a smartphone to see its data displayed
- Turn the sensor on to see the data (wait time approx. two seconds)
- Click the 'add' button to add the sensor to your dashboard
Demonstrarion

Issues
Any browser that does not support WebSockets will not be able to view the graphs. Google chrome and Safari support it, but Opera and Firefox have it disabled by default and you will need to enable it.
Technologies
Code
Possible Improvements
UDP sacrifices reliability for latency and therefore is more suited to streaming data in real time, such as VoIP etc. Therefore when the data is needed fast, such as with an accelerometer, this could be a better option if latency is becoming a problem.
Currently the server does not hold or manipulate the data in any way other than rejecting incomplete data. The client only displays the data received since its connection. A possible improvement might be to store the data on the server in some sort of database for histories.