HYT humidity & temp sensor polling / showing received data at TFT with capacitive touchscreen
Dependencies: FT800_2 HYT mbed
HYT humidity & temperature sensor: polling and showing data at TFT via graphical controller FT800/FT801.
Hardware
- HYT-271 / HYT-221 / HYT-939 humidity and temperature sensor by IST-AG
- TFT module uxTouch by Riverdi
- Break Out Board 20 by Riverdi
- Any mbed platform with I2C interface, SPI interface and 2 free GPIO for PD and INT signals
For documentation on the FT800 library, please refer to the library pages.
Connection
MCU-board to TFT-module
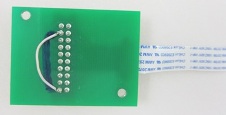
MCU-board is connected to TFT-module via Break Out Board. You need 6 signals to connect: SCK, MOSI and MISO are connected to a SPI channel, SS is the chip select signal, PD work as powerdown and INT for interrupts from TFT to MCU.

You have to connect VDD to BLVDD at Break Out Board if you use the board:

MCU-board to HYT sensor
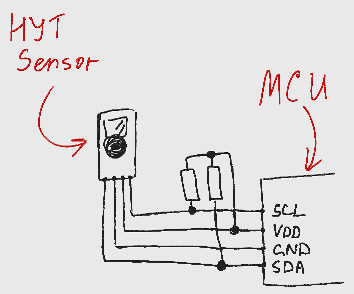
MCU-board is connected to sensor via I2C. Remember to use pull-up resisrors there:

Подробнее в статьях Как перестать бояться и полюбить mbed [Часть 1 - 5] на https://habrahabr.ru/users/uuuulala/topics/
Diff: TFT/display.Draw_30minStatistics.cpp
- Revision:
- 0:5d3131d1b142
diff -r 000000000000 -r 5d3131d1b142 TFT/display.Draw_30minStatistics.cpp
--- /dev/null	Thu Jan 01 00:00:00 1970 +0000
+++ b/TFT/display.Draw_30minStatistics.cpp	Fri Oct 07 11:08:19 2016 +0000
@@ -0,0 +1,181 @@
+#include "display.h"
+
+/**************************************************************************************************************************
+************************** Display data about humidity in the 30-minutes interval *****************************************
+**************************************************************************************************************************/
+
+void Display::StatHumidity_30min(volatile uint64_t seconds, short int statistics24hrs[3][288], uint64_t gridSecondsOffset)
+{
+    // start FT800 display list
+    StartDL();
+
+    // mark the plot area as touch input (to return to 24-hrs statistics)
+    (*_TFT).DL(COLOR_RGB(213, 213, 213));
+    (*_TFT).DL(TAG_MASK(1));
+    (*_TFT).DL(TAG(STAT_HUM_PRESS));
+    (*_TFT).DL(BEGIN(RECTS));
+    (*_TFT).DL(VERTEX2II(25, 100, 0, 0));
+    (*_TFT).DL(VERTEX2II(433, 200, 0, 0));
+    (*_TFT).DL(TAG_MASK(0));
+
+    // create time string, GridLines, link to main menu
+    TimeSinceTurnOn(seconds);
+    VerticalGrid30min(gridSecondsOffset);
+    HorisontalGrid_Statistics_Humidity();
+    MainMenuReference();
+
+    // draw graph line
+    for (int i = 0; i < 6; i++) {
+        char currentValue = statistics24hrs[0][i + timePoint3hrs + timePoint30min];
+        char currentMinValue = statistics24hrs[1][i + timePoint3hrs + timePoint30min];
+        char currentMaxValue = statistics24hrs[2][i + timePoint3hrs + timePoint30min];
+        if (currentValue != INIT_STATISTICS_NUMBER && (i + timePoint3hrs + timePoint30min) != 0) {
+            if (currentMaxValue - currentMinValue >= DELTA_HUMIDITY) {
+                (*_TFT).DL(COLOR_RGB(207, 45, 13));
+                (*_TFT).Number(i * 68, 200 - currentMaxValue - 15, 26, 0, currentMaxValue);
+                (*_TFT).Number(i * 68, 200 - currentMinValue + 1, 26, 0, currentMinValue);
+                (*_TFT).Number(i * 68 + 43, 200 - currentValue - 7, 26, 0, currentValue);
+            } else {
+                (*_TFT).DL(COLOR_RGB(9, 0, 63));
+                (*_TFT).Number(i * 68 + 43, 200 - currentValue - 7, 26, 0, currentValue);
+            }
+            (*_TFT).DL(BEGIN(LINES));
+            (*_TFT).DL(LINE_WIDTH(16));
+            (*_TFT).DL(VERTEX2F((i * 68 + 25) * 16, (200 - currentValue) * 16));
+            (*_TFT).DL(VERTEX2F((i * 68 + 25) * 16, (200 - currentMaxValue) * 16));
+            (*_TFT).DL(VERTEX2F((i * 68 + 10) * 16, (200 - currentMaxValue) * 16));
+            (*_TFT).DL(VERTEX2F((i * 68 + 40) * 16, (200 - currentMaxValue) * 16));
+            (*_TFT).DL(END());
+
+            (*_TFT).DL(BEGIN(LINES));
+            (*_TFT).DL(LINE_WIDTH(16));
+            (*_TFT).DL(VERTEX2F((i * 68 + 25) * 16, (200 - currentValue) * 16));
+            (*_TFT).DL(VERTEX2F((i * 68 + 25) * 16, (200 - currentMinValue) * 16));
+            (*_TFT).DL(VERTEX2F((i * 68 + 10) * 16, (200 - currentMinValue) * 16));
+            (*_TFT).DL(VERTEX2F((i * 68 + 40) * 16, (200 - currentMinValue) * 16));
+            (*_TFT).DL(END());
+
+            (*_TFT).DL(BEGIN(POINTS));
+            (*_TFT).DL(POINT_SIZE(70));
+            (*_TFT).DL(VERTEX2F((i * 68 + 25) * 16, (200 - currentValue) * 16));
+            (*_TFT).DL(END());
+
+            (*_TFT).DL(BEGIN(LINES));
+            (*_TFT).DL(LINE_WIDTH(24));
+            (*_TFT).DL(VERTEX2F((i * 68 + 15) * 16, (200 - currentValue) * 16));
+            (*_TFT).DL(VERTEX2F((i * 68 + 35) * 16, (200 - currentValue) * 16));
+            (*_TFT).DL(END());
+        }
+        if (timePoint3hrs + timePoint30min == 0) {
+            (*_TFT).DL(COLOR_RGB(9, 0, 63));
+            (*_TFT).DL(BEGIN(POINTS));
+            (*_TFT).DL(POINT_SIZE(70));
+            (*_TFT).DL(VERTEX2F(25 * 16, (200 - statistics24hrs[0][0]) * 16));
+            (*_TFT).DL(END());
+        }
+    }
+
+    // write main title
+    (*_TFT).DL(COLOR_RGB(0, 0, 0));
+    (*_TFT).Text(11, 15, 30, 0, "Humidity statistics (30 min)");
+
+    // finish FT800 display list
+    FinishDL();
+}
+
+/**************************************************************************************************************************
+************************** Display data about temperature in the 30-minutes interval **************************************
+**************************************************************************************************************************/
+
+void Display::StatTemperature_30min(volatile uint64_t seconds, short int statistics24hrs[3][288], uint64_t gridSecondsOffset)
+{
+    // strings needed to output temperature values with decimal mark
+    char currentValueStr[8], currentMinValueStr[8], currentMaxValueStr[8];
+
+    // start FT800 display list
+    StartDL();
+
+    // mark the plot area as touch input (to return to 24-hrs statistics)
+    (*_TFT).DL(COLOR_RGB(213, 213, 213));
+    (*_TFT).DL(TAG_MASK(1));
+    (*_TFT).DL(TAG(STAT_TEMP_PRESS));
+    (*_TFT).DL(BEGIN(RECTS));
+    (*_TFT).DL(VERTEX2II(25, 100, 0, 0));
+    (*_TFT).DL(VERTEX2II(433, 200, 0, 0));
+    (*_TFT).DL(TAG_MASK(0));
+
+    // create time string, GridLines, link to main menu
+    TimeSinceTurnOn(seconds);
+    VerticalGrid30min(gridSecondsOffset);
+    HorisontalGrid_Statistics_Temperature();
+    MainMenuReference();
+
+    // draw graph line
+    // Temperature values are multiplied by 10 in the statistics data array.
+    // To receive "normal" temperature with decimal mark we have to divide it
+    for (int i = 0; i < 6; i++) {
+        char currentValue_toDraw = (statistics24hrs[0][i + timePoint3hrs + timePoint30min] / TEMPERATURE_MULTIPLIER + 50) * 0.57;
+        char currentMinValue_toDraw = (statistics24hrs[1][i + timePoint3hrs + timePoint30min] / TEMPERATURE_MULTIPLIER + 50) * 0.57;
+        char currentMaxValue_toDraw = (statistics24hrs[2][i + timePoint3hrs + timePoint30min] / TEMPERATURE_MULTIPLIER + 50) * 0.57;
+
+        short int currentValue_multiplied = statistics24hrs[0][i + timePoint3hrs + timePoint30min];
+        CreateStringMultipliedTemp(currentValueStr, currentValue_multiplied);
+        short int currentMinValue_multiplied = statistics24hrs[1][i + timePoint3hrs + timePoint30min];
+        CreateStringMultipliedTemp(currentMinValueStr, currentMinValue_multiplied);
+        short int currentMaxValue_multiplied = statistics24hrs[2][i + timePoint3hrs + timePoint30min];
+        CreateStringMultipliedTemp(currentMaxValueStr, currentMaxValue_multiplied);
+
+        short int delta = currentMaxValue_multiplied - currentMinValue_multiplied;
+        if (currentValue_multiplied != INIT_STATISTICS_NUMBER && (i + timePoint3hrs + timePoint30min) != 0) {
+            if (delta >= DELTA_TEMPERATURE * TEMPERATURE_MULTIPLIER) {
+                (*_TFT).DL(COLOR_RGB(207, 45, 13));
+                (*_TFT).Text(i * 68 + 5, 200 - currentMaxValue_toDraw - 17, 20, 0, currentMaxValueStr);
+                (*_TFT).Text(i * 68 + 5, 200 - currentMinValue_toDraw + 3, 20, 0, currentMinValueStr);
+                (*_TFT).Text(i * 68 + 43, 200 - currentValue_toDraw - 7, 26, 0, currentValueStr);
+            } else {
+                (*_TFT).DL(COLOR_RGB(9, 0, 63));
+                (*_TFT).Text(i * 68 + 43, 200 - currentValue_toDraw - 7, 26, 0, currentValueStr);
+            }
+            (*_TFT).DL(BEGIN(LINES));
+            (*_TFT).DL(LINE_WIDTH(16));
+            (*_TFT).DL(VERTEX2F((i * 68 + 25) * 16, (200 - currentValue_toDraw) * 16));
+            (*_TFT).DL(VERTEX2F((i * 68 + 25) * 16, (200 - currentMaxValue_toDraw) * 16));
+            (*_TFT).DL(VERTEX2F((i * 68 + 10) * 16, (200 - currentMaxValue_toDraw) * 16));
+            (*_TFT).DL(VERTEX2F((i * 68 + 40) * 16, (200 - currentMaxValue_toDraw) * 16));
+            (*_TFT).DL(END());
+
+            (*_TFT).DL(BEGIN(LINES));
+            (*_TFT).DL(LINE_WIDTH(16));
+            (*_TFT).DL(VERTEX2F((i * 68 + 25) * 16, (200 - currentValue_toDraw) * 16));
+            (*_TFT).DL(VERTEX2F((i * 68 + 25) * 16, (200 - currentMinValue_toDraw) * 16));
+            (*_TFT).DL(VERTEX2F((i * 68 + 10) * 16, (200 - currentMinValue_toDraw) * 16));
+            (*_TFT).DL(VERTEX2F((i * 68 + 40) * 16, (200 - currentMinValue_toDraw) * 16));
+            (*_TFT).DL(END());
+
+            (*_TFT).DL(BEGIN(POINTS));
+            (*_TFT).DL(POINT_SIZE(70));
+            (*_TFT).DL(VERTEX2F((i * 68 + 25) * 16, (200 - currentValue_toDraw) * 16));
+            (*_TFT).DL(END());
+
+            (*_TFT).DL(BEGIN(LINES));
+            (*_TFT).DL(LINE_WIDTH(24));
+            (*_TFT).DL(VERTEX2F((i * 68 + 15) * 16, (200 - currentValue_toDraw) * 16));
+            (*_TFT).DL(VERTEX2F((i * 68 + 35) * 16, (200 - currentValue_toDraw) * 16));
+            (*_TFT).DL(END());
+        }
+        if (timePoint3hrs + timePoint30min == 0) {
+            (*_TFT).DL(COLOR_RGB(9, 0, 63));
+            (*_TFT).DL(BEGIN(POINTS));
+            (*_TFT).DL(POINT_SIZE(70));
+            (*_TFT).DL(VERTEX2F(25 * 16, (200 - statistics24hrs[0][0]) * 16));
+            (*_TFT).DL(END());
+        }
+    }
+
+    // write main title
+    (*_TFT).DL(COLOR_RGB(0, 0, 0));
+    (*_TFT).Text(11, 15, 30, 0, "Temperature statistics (30 min)");
+
+    // finish FT800 display list
+    FinishDL();
+}
\ No newline at end of file