LPC4088 QuickStart Board - Development Environment
The mbed Compiler gives you instant access to lightweight C/C++ microcontroller development. It is an online web application IDE (Integrated Development Environment) that you can log in from anywhere and work on Windows, Mac, iOS, Android or Linux. For a quick guide how to write code, compile and download to the LPC4088 QuickStart Board, see here: Getting Started Tour
The mbed Compiler has some limitations, mainly when it comes to debugging. There are alternatives to the online compiler when more professional program development and debugging is needed. The mbed framework and the application code can be exported from the online compiler and imported into an offline toolchain. For more details, see here: Exporting to Offline Toolchains
Currently there are guides for exporting to:
- uVision
- LPCXpresso IDE
- CodeSourcery
- GCC ARM Embedded
- IAR Embedded Workbench
Under these toolchains it is possible to perform advanced debugging with breakpoints, inspecting variable values, dumping memory regions and even trace the program execution flow (provided the debug probe supports the feature).
How to debug
The LPC4088 QuickStart Board offers several different debug methods.
HDK
The mbed Hardware Development Kit (HDK) is included (which is part of what makes the module an mbed module). The HDK offers the following features over a common USB connection (the HDK USB port):
- USB drag-n-drop programming of the target processor. A USB Mass Storage Device (MSD) is created and the binary image that the compiler created can just be dragged and dropped on this drive on the PC-side. The image will then automatically be flashed to the LPC4088 QuickStart Board.
- Virtual serial port, which creates a virtual COM port on the PC-side. There is a serial (UART) channel on the LPC4088 QuickStart Board that can be tunneled over to the PC-side for debug, logging, statistics or other reasons.
- CMSIS-DAP debug interface, which basically creates a SW debug interface to the LPC4088. The CMSIS-DAP interface is supported by major tool vendors (see section about Exporting to offline toolchains).
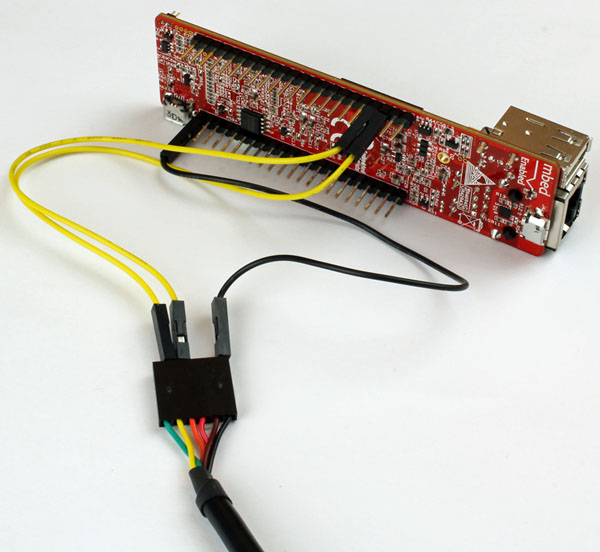
The virtual serial port channel (pins P0.2/P0.3 on the LPC4088) is also available on pin P41/P42. If, for some reason, the HDK interface cannot be used in your debugging it is possible to connect an FTDI-cable to this UART interface, see picture below. It is recommended to disable the HDK functionality by removing the jumper in JP3 before connecting anything to P41 (else there will be multiple drivers on the signal).

The mbed website has a separate Debugging section in the Handbook. This guide presents some techniques for generating debug information to help find and fix problems with user code when using the HDK features.
SW / Trace
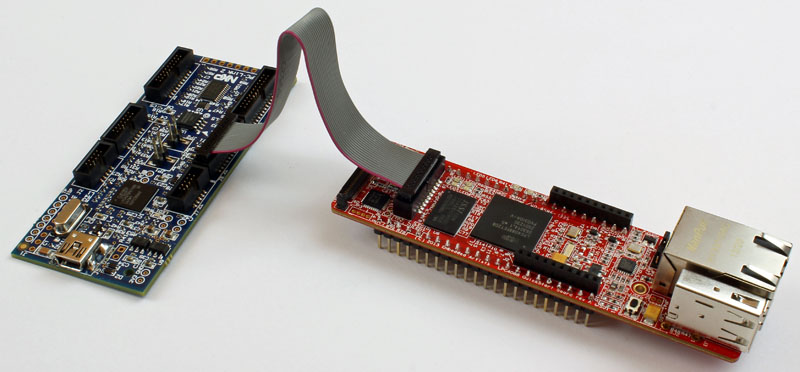
The LPC4088 QuickStart Board also offers direct access to the Serial Wire (SW) and trace debug interface of the LPC4088 MCU. Any external debug probe that supports the LPC4088 and the 20-pin SW interface, called the Cortex Debug+ETM Connector, can be connected to this interface. The LPC-Link 2 debug probe directly supports the 20-pin connector, see picture below. The cheap 20 EUR package of EA-XPR-200 (LPC-Link 2) and EX-ACC-014 (20-pos flat cable) are needed to connect to the 20-pin SW interface (J7 in the LPC4088 QuickStart Board) and creates a powerful, professional quality debug interface.

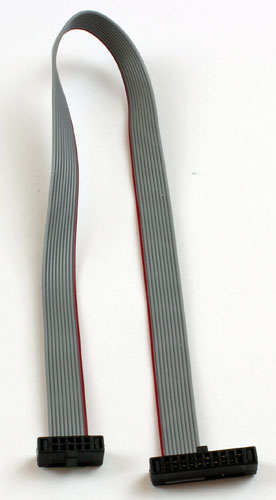
The 10-pin SW interface, called the Cortex Debug Connector, is common on many debug probes. This interface can easily be supported via a special cable that connect only the first 10 position on the 20-pos connector on the LPC4088 QuickStart Board. The picture below shows how the cable looks like (included in the ULINK-PRO package).

1 comment on LPC4088 QuickStart Board - Development Environment:
Please log in to post comments.

Dear staff,
I would like to debug LPC4088 by using ULINK-Pro employing its ETM function, not by using mbed HDK on the board.
Is there any cautions or notes for powering scheme, some jummer settings (to disable HDK?) etc... ?
Thanks,