Techniques for Debugging BLE apps
Here are some of the strategies I use to debug mbed apps that I've been
developing using mbed+BLE_API. I'm not a fast programmer anymore, but I'm a
successful programmer. Not that my skills have lost their edge over time, but
my sense of my limitations has come to the fore, and I've become more
compassionate in my relationship to the art of programming.
Nearly all application development requires debugging; regardless of the
programmer's skill. Even documentation requires debugging and refinement
(without which it is buggy); it is a very similar art, but it is better
tackled as an entirely different discussion.
Interface Chip
mbed platforms come with an interface chip placed between the target
microcontroller and the development host. This interface chip plays a key role
in debugging. It is effectively a USB-bridge between the development host and
the debugging capabilities available in ARM microcontrollers. This bridge
functionality is encapsulated in a standard called
CMSIS-DAP that major
toolchain vendors have started to support; i.e. it will grow in popularity and
availability over time. Some of the terms in the following picture will become
clearer as we head through the document.
+-------------+       +------------------------------------------------------------------------------+
|             |       |                                                                              |
|             |       |         mbed Platform                                                        |
|             |       |         (development board)         +-------target system-----------------+  |
|             |       |                                     |                                     |  |
|             |       +-------+                             |  +--------------+  +-------------+  |  |
|             |       | reset +--------------------------+  |  |  peripheral  |  |  peripheral |  |  |
|             |       +-------+                          |  |  +--------------+  +-------------+  |  |
|             |       |           +--------------+       |  |  +--------------+                   |  |
|             |       |           |              |  reset|  |  |              |  +-------------+  |  |
|             |       +---+       |              +-------+----->              |  |  peripheral |  |  |
| development |  USB  |   |       |              |          |  |              |  +-------------+  |  |
| host        |XXXXXXX|USB+-------+  interface   |  SWD     |  |  target MCU  |                   |  |
|             |       |   |       |  chip        +-------------+              |  +-------------+  |  |
|             |       +---+       |  (CMSIS+DAP) |          |  |              |  |  peripheral |  |  |
|             |       |           |              |  UART    |  |              |  +-------------+  |  |
|             |       |           |              +-------------+              |                   |  |
|             |       |           +--------------+          |  +--------------+  +-------------+  |  |
|             |       |                                     |                    |  peripheral |  |  |
|             |       +--------+                            |  +--------------+  +-------------+  |  |
|             |       | target |                            |  |  peripheral  |                   |  |
|             |       | power  +---------------------------->  +--------------+                   |  |
|             |       +--------+                            |                                     |  |
|             |       |                                     +-------------------------------------+  |
|             |       |                                                                              |
+-------------+       +------------------------------------------------------------------------------+
printf()
printf() is a friend to keep. It is the first thing I reach out for when in
need; else I avoid it, which is not how you should treat friends. printf() is
often 'retargetted' to emit characters on the micro-controller's UART console
peripheral (often called console for short); nearly all micro-controllers have
UART, often more than one. The interface chip forwards console UART activity
bi-directionally between the target microcontroller and the host. Users may
interface with this activity through a terminal program on the host (such as
teraterm, hyperterm, minicom, or whatever else boils your soup in your world).
UART is a beautiful, mature serial protocol where the sender and receiver each
maintain their own clocks and synchronize with communication independently.
Both sides need to know the communication speed in order to talk successfully.
This speed is called baud-rate; and is limited to a small number of well-known
and over-used values. mbed interface-chips like to communicate at 9600 baud,
so you'll have to set your soup-boiler (er, terminal program) to go at that
rate.
printf() comes at a cost. Several technical costs to be more accurate. For
one, any use of printf() bloats program size by 5K to 10K of flash use; this
may or may not be a problem, but makes a good case to avoid printf()s entirely
when not needed. This price for size is paid even if printf() is used only
once; and thereafter there is almost no additional cost in terms of size in
re-using it. printf() also takes a significant amount of processing and time
to execute. As a rule of thumb, a call to printf() takes around 10
milliseconds to run; and costs around 100K instructions. These are expensive
costs. It could easily be more pricey than that if your particular version of
printf() allows for more formatting options; or if your clock runs slower.
printf() is expensive enough that sometimes it can be used as a delay.
A lot of embedded programming is meant for event and interrupt handlers which
are expected to have a very quick turn-around; i.e. they are expected to
terminate within a few microseconds. Calling printf()s from event handlers
ought to make a programmer uneasy. Use printf()s judiciously.
#include <stdio.h>

... somewhere later ...

    printf("debug value %x\r\n", value);
Useful macros built upon printf()
There are some nifty tricks you can do with pre-processor macros using printf()s
-- within some header file named like trace.h --
enum {
    TRACE_LEVEL_DEBUG,
    TRACE_LEVEL_WARNING
};

extern unsigned traceLevel;

...

// Trace output depends on traceLevel value
#define TRACE_DEBUG(...)      { if (traceLevel >= TRACE_LEVEL_DEBUG)   { printf("-D- " __VA_ARGS__); } }
#define TRACE_WARNING(...)    { if (traceLevel >= TRACE_LEVEL_WARNING) { printf("-W- " __VA_ARGS__); } }
Here's a contribution from some user:
#define LOG(x, ...)  { printf("\x1b[34m%12.12s: \x1b[39m"x"\x1b[39;49m\r\n", MODULE_NAME, ##__VA_ARGS__); fflush(stdout); }
#define WARN(x, ...) { printf("\x1b[34m%12.12s: \x1b[33m"x"\x1b[39;49m\r\n", MODULE_NAME, ##__VA_ARGS__); fflush(stdout); }
Set #define MODULE_NAME "<YourModuleName>" before #including the above code, and enjoy colourised, formatted printf tagged with the module name that generated it.
Fast Circular Log-buffers based on printf()
There are times when it is desirable to capture printf() based debug logs from
events which occur in very rapid succession. Using the normal printf() under
these conditions may introduce unacceptable run-time latencies which alter the
system's behavior or cause further instability.
With printf(), the bigger contribution to the execution delay comes from
having to push out the characters to the UART; formatting the message is
significantly less expensive.
Instead of using printf(), it is possible to use sprintf() to write log
messages into a circular buffer which then gets emitted to a console during
idle time (possible from the main loop). I often build macros to do such fast,
circular logging. I'll leave the implementation to you, dear reader.
LEDs
I think of LEDs as a micro-printf(). It often can speak a very limited language, but is able to communicate at near zero cost. None of the size or processing costs associated with printf() apply to LEDs.
#include <mbed.h>

DigitalOut led(LED1);

... somewhere later ...

    led = 1; /* writing 1 to an LED usually turns it on; but your world could be topsy turvy. */

... or perhaps in some other file ...

    extern DigitalOut led;
    led = 0;
LEDs are often used very effectively to indicate that program control reached
some particular state (such as an error condition). I sometimes turn on an LED
at the start of a program to prove that code is actually running.
LEDs are often successfully used to indicate normal program activity. If the
main loop of an application is toggling an LED every once in a while, then a
continuation of this heart-beat blinking behavior indicates that the main loop
is able receive control and attention from the processor. Program flow can be
broken down into the main loop and event handlers. Event handlers run at
interrupt priority and can preempt the main main loop. Systems become unusable
if any event handler fails to complete, or if there is a program fault which
causes a lockup in some fault-handler. In all these cases, the main loop fails
to receive control, and having a toggling heart-beat LED can help isolate
this.
error()
Runtime errors are caused either by code that is correct but tries to do
something that is invalid, or when malfunctioning hardware cannot be accessed.
mbed SDK comes with a nice utility function called error() which takes in
printf() style parameters but then also sets the LEDs blinking in a pattern
which is easy to identify as an alert; this has the benefit that a user may
get a visual error indication even if she isn't monitoring UART console
output.
See here for more.
I sometimes use the following to allow me the use of ASSERT() in my code.
    #define ASSERT(condition, ...)  {               \
        if (!(condition)) {                         \
            error("ASSERT: " __VA_ARGS__);          \
        }                                           \
    }
Having ASSERT() enables better error reporting.
<<From here on, the techniques presented demand a quantum jump in complexity.>>
UART BLE Service
If, for whatever reason, you don't have console UART access over a USB to UART
bridge created by the interface chip, you can still receive debug output over
a connection to the Bluetooth Smart UART service. There are various apps to
receive this stream on the other end; Nordic's nRF UART being one example.
Here's what it takes on the peripheral application to use the UARTService.
    uart = new UARTService(ble);

    ... and anytime later ...

    uart->write("some update\r\n", strlen("some update\r\n"));
The above expression for uart->write(X, strlen(X)) can be contracted into a
preprocessor macro for ease of use.
Admittedly, this is not the same level of experience as offered by printf()s;
one uses write() as opposed to printf(), and that requires preparing the
output message previously. One also needs to pass in a length argument.
Please be aware that presently it is possible to have only a single active
connection to a BLE device; so let's say you're working with a modification to
the heart-rate application which uses the UARTService for debug output, and if
you've connected to it using nRF UART for console output, then you cannot
simultaneously connect to it from another heart-rate phone app.
PyOCD based debugging (GDB server)
printf()s and LEDs are great when making small changes to a stable
application. But there are times when these approaches aren't enough because
it is unclear where the problem may lie. In those cases, one may need to hook
a debugger to the target to observe state.
Programs written for microcontrollers often lack support for proper exception
or error handling (owing to size and performance limitations); exceptional
conditions such as use of un-initialized memory or out-of-bounds memory
accesses result in the hardware-driven invocation of general-purpose fault
handlers, which by default don't yield any information about the root cause.
Thus, a program failure often results in a system freeze, leaving the user
(and more frustratingly the application developer) wondering what may have
gone awry.
The interface chip on mbed platforms also connects to the target using SWD;
which stands for serial-wire-debug, which is a communication bus and protocol
offering debugging capabilities for stack trace analysis, register dumps, and
inspection of program execution by being able to setup breakpoints,
watchpoints, etc. When combined with a source-level debugger on the
development host, such as the venerable gdb, SWD connectivity through the
interface chip offers very rich debugging experience.
As mentioned previously, the interface chip implements CMSIS-DAP, which is a
standard for a USB bridge between a development host and the debugging
capabilities of ARM Cortex microcontrollers. mbed maintains a Python library
called pyOCD to drive the CMSIS-DAP
interface chip over USB.
+----------------------------+         +--------------------------------+
|                            |         |                                |
|            Host            |         |   Mbed Platform   +----------+ |
|                            |         |                   |          | |
|    +--------+   +-------+  |         |                   |          | |
|    |        |   |       |  |         | +-----------+     |          | |
|    | GDB    +---+       |  |         | |           |     |  target  | |
|    | server |   |       |  |   USB   | |           |     |  micro   | |
|    +--------+   | PyOCD |  |XXXXXXXXX| |Interface  | SWD |          | |
|                 |       |  |         | |Chip       +-----+ Cortex M | |
|    +--------+   |       |  |         | |(CMSIS-DAP)|     |          | |
|    |        +---+       |  |         | |           |     |          | |
|    | Python |   +-------+  |         | +-----------+     |          | |
|    | scripts|              |         |                   +----------+ |
|    |        |              |         +-------------------+----------+-+
|    +--------+              |
|                            |
+----------------------------+
Please follow the installation instructions for pyOCD as it relies on external USB
libraries. Note: you'll need to run 'setup.py' for both the USB libraries and
pyOCD. pyOCD also provides a manual HOW_TO_BUILD.md in root folder to explain
how to build pyOCD into single executable gdb server program. A series of
tests are provided in the test sub-folder. You might find several of these
scripts as foundation material for developing custom interaction with the
targets over CMSIS-DAP.
GDB server can be launched by running gdb_server.py. This script should be
able to auto-detect any connected mbed board. With my Nordic mkit attached, I
get the following when executing the script from a terminal.
$ sudo python test/gdb_server.py
Welcome to the PyOCD GDB Server Beta Version
INFO:root:new board id detected: 107002001FE6E019E2190F91
id => usbinfo | boardname
0 =>   (0xd28, 0x204) [nrf51822]
INFO:root:DAP SWD MODE initialised
INFO:root:IDCODE: 0xBB11477
INFO:root:4 hardware breakpoints, 0 literal comparators
INFO:root:CPU core is Cortex-M0
INFO:root:2 hardware watchpoints
INFO:root:GDB server started at port:3333
At this point, the target microcontroller has been halted waiting for
interaction from a gdb server. This server is running at port 3333 on the
development host, and may be connected to from a debugger such as gdb.
Warning: using gdb (or another debugger) to connect to the gdb server becomes
useful only when one has access to the program symbols and their addresses.
This is currently *not* exported when building binaries (.hex files) using the
mbed online IDE. You would need to export your project to an offline toolchain
to be able to generate either an .elf file which holds symbols alongside the
program; or alternatively a .map file for symbols. We'll assume that you have
a .elf file for your project.
Here's how I launch my gdb client:
~/play/demo-apps/BLE_Beacon/Build$ arm-none-eabi-gdb BLE_BEACON.elf
GNU gdb (GNU Tools for ARM Embedded Processors) 7.6.0.20140731-cvs
Copyright (C) 2013 Free Software Foundation, Inc.
License GPLv3+: GNU GPL version 3 or later <http://gnu.org/licenses/gpl.html>
This is free software: you are free to change and redistribute it.
There is NO WARRANTY, to the extent permitted by law.  Type "show copying"
and "show warranty" for details.
This GDB was configured as "--host=x86_64-unknown-linux-gnu --target=arm-none-eabi".
For bug reporting instructions, please see:
<http://www.gnu.org/software/gdb/bugs/>...
Reading symbols from /home/rgrover/play/demo-apps/BLE_Beacon/Build/BLE_BEACON.elf...
warning: Loadable section "RW_IRAM1" outside of ELF segments
(gdb)
Notice that I pass in the .elf file as an argument. I could also have used the
'file' command within gdb to load symbols from this .elf file after starting
gdb. The command set offered by gdb to help with symbol management and
debugging is outside the scope of this document.
I connect to the gdb server as follows:
(gdb) target remote localhost:3333
Remote debugging using localhost:3333
warning: Loadable section "RW_IRAM1" outside of ELF segments
HardFault_Handler ()
    at /home/rgrover/play/mbed-src/libraries/mbed/targets/cmsis/TARGET_NORDIC/TARGET_MCU_NRF51822/TOOLCHAIN_ARM_STD/TARGET_MCU_NORDIC_16K//startup_nRF51822.s:115
115                 B       .
(gdb)
And from this gdb command console, I can proceed to have a normal debugging
interaction. The GUI-hearted amongst you would surely find a way to replicate
this exchange in your preferred applications.
Warning: this is a big hammer; use it when appropriate, but overuse comes with
the risk of dulling your sensitivity to what can be achieved by less weighty
but very effective tools like an LED or printf().
Using a BLE Sniffer
Sometimes it is really helpful to capture a trace of Bluetooth smart messages
being exchanged over the ether. This sort of tracing can, for instance, help
determine if connection parameters (such as 'connection interval') are being
honored.
There are several tools to sniff radio activity into logs that can later be
analyzed with tools like Wireshark. One previously needed specialized hardware
to capture air traces; but smart-phones make it really easy to do the sniffing
now. There's an Android app called 'Bluetooth HCI Logger' for this. You can
also find literature around enabling Android's 'Bluetooth HCI Snoop Log'
developer option. If you still feel the need for a physical sniffer, here's a
low-cost alternative: nRF-Sniffer which can do much more
than sniffing.
 Janek Mann.
12
replies
Janek Mann.
12
replies


Techniques for Debugging BLE apps
Here are some of the strategies I use to debug mbed apps that I've been developing using mbed+BLE_API. I'm not a fast programmer anymore, but I'm a successful programmer. Not that my skills have lost their edge over time, but my sense of my limitations has come to the fore, and I've become more compassionate in my relationship to the art of programming.
Nearly all application development requires debugging; regardless of the programmer's skill. Even documentation requires debugging and refinement (without which it is buggy); it is a very similar art, but it is better tackled as an entirely different discussion.
Interface Chip
mbed platforms come with an interface chip placed between the target microcontroller and the development host. This interface chip plays a key role in debugging. It is effectively a USB-bridge between the development host and the debugging capabilities available in ARM microcontrollers. This bridge functionality is encapsulated in a standard called CMSIS-DAP that major toolchain vendors have started to support; i.e. it will grow in popularity and availability over time. Some of the terms in the following picture will become clearer as we head through the document.
printf()
printf() is a friend to keep. It is the first thing I reach out for when in need; else I avoid it, which is not how you should treat friends. printf() is often 'retargetted' to emit characters on the micro-controller's UART console peripheral (often called console for short); nearly all micro-controllers have UART, often more than one. The interface chip forwards console UART activity bi-directionally between the target microcontroller and the host. Users may interface with this activity through a terminal program on the host (such as teraterm, hyperterm, minicom, or whatever else boils your soup in your world).
UART is a beautiful, mature serial protocol where the sender and receiver each maintain their own clocks and synchronize with communication independently. Both sides need to know the communication speed in order to talk successfully. This speed is called baud-rate; and is limited to a small number of well-known and over-used values. mbed interface-chips like to communicate at 9600 baud, so you'll have to set your soup-boiler (er, terminal program) to go at that rate.
printf() comes at a cost. Several technical costs to be more accurate. For one, any use of printf() bloats program size by 5K to 10K of flash use; this may or may not be a problem, but makes a good case to avoid printf()s entirely when not needed. This price for size is paid even if printf() is used only once; and thereafter there is almost no additional cost in terms of size in re-using it. printf() also takes a significant amount of processing and time to execute. As a rule of thumb, a call to printf() takes around 10 milliseconds to run; and costs around 100K instructions. These are expensive costs. It could easily be more pricey than that if your particular version of printf() allows for more formatting options; or if your clock runs slower. printf() is expensive enough that sometimes it can be used as a delay.
A lot of embedded programming is meant for event and interrupt handlers which are expected to have a very quick turn-around; i.e. they are expected to terminate within a few microseconds. Calling printf()s from event handlers ought to make a programmer uneasy. Use printf()s judiciously.
#include <stdio.h> ... somewhere later ... printf("debug value %x\r\n", value);Useful macros built upon printf()
There are some nifty tricks you can do with pre-processor macros using printf()s
-- within some header file named like trace.h -- enum { TRACE_LEVEL_DEBUG, TRACE_LEVEL_WARNING }; extern unsigned traceLevel; ... // Trace output depends on traceLevel value #define TRACE_DEBUG(...) { if (traceLevel >= TRACE_LEVEL_DEBUG) { printf("-D- " __VA_ARGS__); } } #define TRACE_WARNING(...) { if (traceLevel >= TRACE_LEVEL_WARNING) { printf("-W- " __VA_ARGS__); } }Here's a contribution from some user:
#define LOG(x, ...) { printf("\x1b[34m%12.12s: \x1b[39m"x"\x1b[39;49m\r\n", MODULE_NAME, ##__VA_ARGS__); fflush(stdout); } #define WARN(x, ...) { printf("\x1b[34m%12.12s: \x1b[33m"x"\x1b[39;49m\r\n", MODULE_NAME, ##__VA_ARGS__); fflush(stdout); }Set #define MODULE_NAME "<YourModuleName>" before #including the above code, and enjoy colourised, formatted printf tagged with the module name that generated it.
Fast Circular Log-buffers based on printf()
There are times when it is desirable to capture printf() based debug logs from events which occur in very rapid succession. Using the normal printf() under these conditions may introduce unacceptable run-time latencies which alter the system's behavior or cause further instability.
With printf(), the bigger contribution to the execution delay comes from having to push out the characters to the UART; formatting the message is significantly less expensive.
Instead of using printf(), it is possible to use sprintf() to write log messages into a circular buffer which then gets emitted to a console during idle time (possible from the main loop). I often build macros to do such fast, circular logging. I'll leave the implementation to you, dear reader.
LEDs
I think of LEDs as a micro-printf(). It often can speak a very limited language, but is able to communicate at near zero cost. None of the size or processing costs associated with printf() apply to LEDs.
#include <mbed.h> DigitalOut led(LED1); ... somewhere later ... led = 1; /* writing 1 to an LED usually turns it on; but your world could be topsy turvy. */ ... or perhaps in some other file ... extern DigitalOut led; led = 0;LEDs are often used very effectively to indicate that program control reached some particular state (such as an error condition). I sometimes turn on an LED at the start of a program to prove that code is actually running.
LEDs are often successfully used to indicate normal program activity. If the main loop of an application is toggling an LED every once in a while, then a continuation of this heart-beat blinking behavior indicates that the main loop is able receive control and attention from the processor. Program flow can be broken down into the main loop and event handlers. Event handlers run at interrupt priority and can preempt the main main loop. Systems become unusable if any event handler fails to complete, or if there is a program fault which causes a lockup in some fault-handler. In all these cases, the main loop fails to receive control, and having a toggling heart-beat LED can help isolate this.
error()
Runtime errors are caused either by code that is correct but tries to do something that is invalid, or when malfunctioning hardware cannot be accessed. mbed SDK comes with a nice utility function called error() which takes in printf() style parameters but then also sets the LEDs blinking in a pattern which is easy to identify as an alert; this has the benefit that a user may get a visual error indication even if she isn't monitoring UART console output.
See here for more.
I sometimes use the following to allow me the use of ASSERT() in my code.
#define ASSERT(condition, ...) { \ if (!(condition)) { \ error("ASSERT: " __VA_ARGS__); \ } \ }Having ASSERT() enables better error reporting.
<<From here on, the techniques presented demand a quantum jump in complexity.>>UART BLE Service
If, for whatever reason, you don't have console UART access over a USB to UART bridge created by the interface chip, you can still receive debug output over a connection to the Bluetooth Smart UART service. There are various apps to receive this stream on the other end; Nordic's nRF UART being one example.
Here's what it takes on the peripheral application to use the UARTService.
uart = new UARTService(ble); ... and anytime later ... uart->write("some update\r\n", strlen("some update\r\n"));The above expression for uart->write(X, strlen(X)) can be contracted into a preprocessor macro for ease of use.
Admittedly, this is not the same level of experience as offered by printf()s; one uses write() as opposed to printf(), and that requires preparing the output message previously. One also needs to pass in a length argument.
Please be aware that presently it is possible to have only a single active connection to a BLE device; so let's say you're working with a modification to the heart-rate application which uses the UARTService for debug output, and if you've connected to it using nRF UART for console output, then you cannot simultaneously connect to it from another heart-rate phone app.
PyOCD based debugging (GDB server)
printf()s and LEDs are great when making small changes to a stable application. But there are times when these approaches aren't enough because it is unclear where the problem may lie. In those cases, one may need to hook a debugger to the target to observe state.
Programs written for microcontrollers often lack support for proper exception or error handling (owing to size and performance limitations); exceptional conditions such as use of un-initialized memory or out-of-bounds memory accesses result in the hardware-driven invocation of general-purpose fault handlers, which by default don't yield any information about the root cause. Thus, a program failure often results in a system freeze, leaving the user (and more frustratingly the application developer) wondering what may have gone awry.
The interface chip on mbed platforms also connects to the target using SWD; which stands for serial-wire-debug, which is a communication bus and protocol offering debugging capabilities for stack trace analysis, register dumps, and inspection of program execution by being able to setup breakpoints, watchpoints, etc. When combined with a source-level debugger on the development host, such as the venerable gdb, SWD connectivity through the interface chip offers very rich debugging experience.
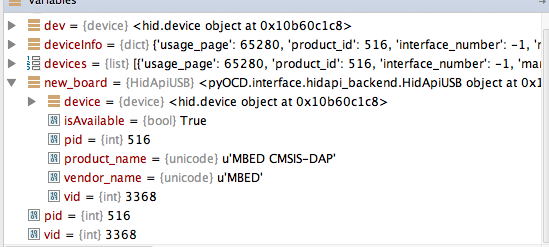
As mentioned previously, the interface chip implements CMSIS-DAP, which is a standard for a USB bridge between a development host and the debugging capabilities of ARM Cortex microcontrollers. mbed maintains a Python library called pyOCD to drive the CMSIS-DAP interface chip over USB.
Please follow the installation instructions for pyOCD as it relies on external USB libraries. Note: you'll need to run 'setup.py' for both the USB libraries and pyOCD. pyOCD also provides a manual HOW_TO_BUILD.md in root folder to explain how to build pyOCD into single executable gdb server program. A series of tests are provided in the test sub-folder. You might find several of these scripts as foundation material for developing custom interaction with the targets over CMSIS-DAP.
GDB server can be launched by running
gdb_server.py. This script should be able to auto-detect any connected mbed board. With my Nordic mkit attached, I get the following when executing the script from a terminal.At this point, the target microcontroller has been halted waiting for interaction from a gdb server. This server is running at port 3333 on the development host, and may be connected to from a debugger such as gdb.
Warning: using gdb (or another debugger) to connect to the gdb server becomes useful only when one has access to the program symbols and their addresses. This is currently *not* exported when building binaries (.hex files) using the mbed online IDE. You would need to export your project to an offline toolchain to be able to generate either an .elf file which holds symbols alongside the program; or alternatively a .map file for symbols. We'll assume that you have a .elf file for your project.
Here's how I launch my gdb client:
Notice that I pass in the .elf file as an argument. I could also have used the 'file' command within gdb to load symbols from this .elf file after starting gdb. The command set offered by gdb to help with symbol management and debugging is outside the scope of this document.
I connect to the gdb server as follows:
(gdb) target remote localhost:3333 Remote debugging using localhost:3333 warning: Loadable section "RW_IRAM1" outside of ELF segments HardFault_Handler () at /home/rgrover/play/mbed-src/libraries/mbed/targets/cmsis/TARGET_NORDIC/TARGET_MCU_NRF51822/TOOLCHAIN_ARM_STD/TARGET_MCU_NORDIC_16K//startup_nRF51822.s:115 115 B . (gdb)And from this gdb command console, I can proceed to have a normal debugging interaction. The GUI-hearted amongst you would surely find a way to replicate this exchange in your preferred applications.
Warning: this is a big hammer; use it when appropriate, but overuse comes with the risk of dulling your sensitivity to what can be achieved by less weighty but very effective tools like an LED or printf().
Using a BLE Sniffer
Sometimes it is really helpful to capture a trace of Bluetooth smart messages being exchanged over the ether. This sort of tracing can, for instance, help determine if connection parameters (such as 'connection interval') are being honored.
There are several tools to sniff radio activity into logs that can later be analyzed with tools like Wireshark. One previously needed specialized hardware to capture air traces; but smart-phones make it really easy to do the sniffing now. There's an Android app called 'Bluetooth HCI Logger' for this. You can also find literature around enabling Android's 'Bluetooth HCI Snoop Log' developer option. If you still feel the need for a physical sniffer, here's a low-cost alternative: nRF-Sniffer which can do much more than sniffing.