STM Studio viewer
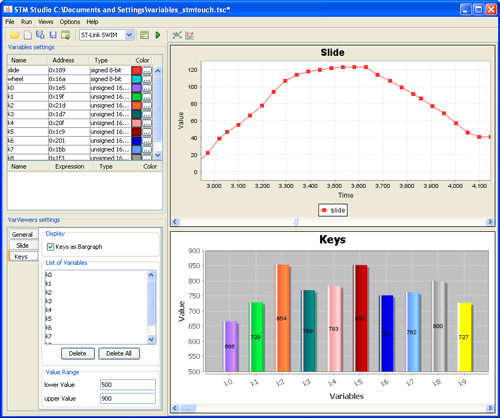
The ARM Cortex M series supports tracing capabilities through the Serial Wire Debug (SWD) en Serial Wire Output(SWO) port. A simple lib for tracing via SWO is available here. The STM Studio application provided for free by ST has significantly more features. STM Studio is a graphical user interface that allows sampling and visualizing in real time of user's variables while the application is running. It is designed to run on PCs with Microsoft Windows operating systems.

This tool works with STM32 microcontrollers through JTAG or SWD (serial wire debug) interface. The ST-LINK/v2-1 interface on the mbed ST nucleo and ST discovery boards can be used with STM Studio. The application code shown here provides an example.
Using STM Studio with mbed online
Download and Install STM Studio from the ST website.
The STM Studio tool can import .elf or .axf files which contain a memory map of all variables used in your code. However, the mbed online compiler does not generate these files, so instead use the following printf() to show the addresses in a terminal window and then figure out where the vars that you want to monitor (or manipulate) are located and manually paste their addresses into STM Studio.
First declare your vars in your code as usual:
int i;
char c;
float s;
bool b1;
volatile int b2 = 1;
float wt = 0.7f;
Add printf() to find memory addresses of those vars you wish to monitor or manipulate while executing your code.
int main() {
  ....
  pc.printf("i is at 0x%08X\r\n", &i);
  pc.printf("c is at 0x%08X\r\n", &c);
  pc.printf("s is at 0x%08X\r\n", &s);
  pc.printf("b1 is at 0x%08X\r\n", &b1);
  pc.printf("b2 is at 0x%08X\r\n", &b2);
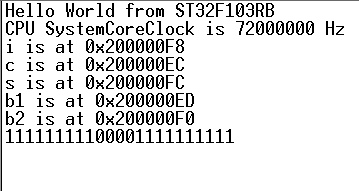
This will show up in your terminal like so:

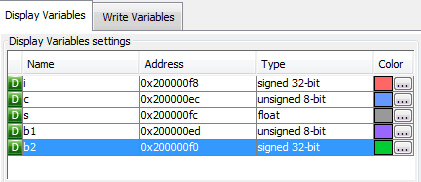
Copy and paste these values into STM Studio:

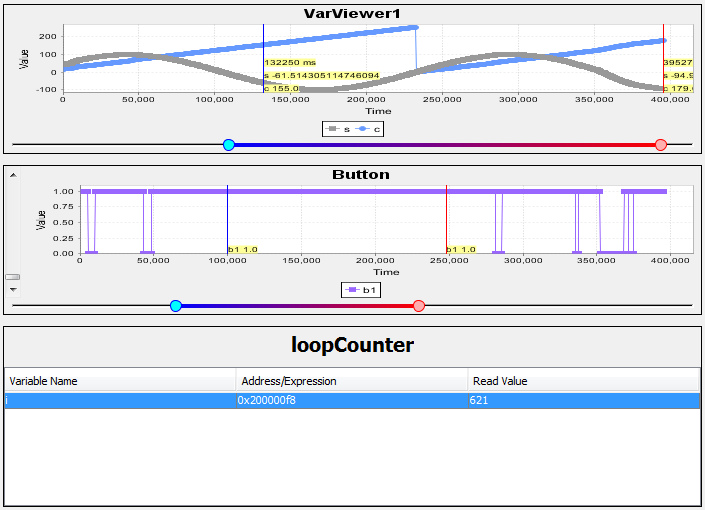
Create the viewers and send the variables to the desired viewer:

Code
The example code shows a graphical plot of a sine (float variable -100.0..100.0), a char counter (0..255) and a boolean for a user button. There is also a variable (b2) that may be changed on the fly through the STM Studio interface and that will modify the behaviour of the software. The code can be found here:
https://developer.mbed.org/users/wim/code/mbed_nucleo_stmstudio/
It should also be possible to monitor peripheral control registers (eg serial port TX, RX, external ports) by looking up the hardware addresses in the device reference manual and adding a watch for that address in STM Studio.
Limitations
- STM Studio runs on Windows only
- STM Studio seems to work only with the STLINK interface. Does not run on the mbed interface on the mbed LPC1768. May work with processors from other vendors when using STLINK (not tested)
- There are limits to the maximum update rates of monitored variables.
Wishlist
- It would be really nice to have an option in the online mbed environment to generate not only .bin, but also either .hex or .elf etc files so you could import the variables and addresses in STM Studio.
- It would be really useful to have a more advanced (probably locally installed) debugging and monitoring tool available with the mbed online environment. Something like STM Studio, but vendor independent. What happened to the announcements that CMSIS-DAP support for the mbed interface was the first step in that direction?
References
1 comment on STM Studio viewer:
Please log in to post comments.

Thank you very much. I was having trouble getting STMStudio to import .elf files created by mbed or platformio. But the solution that you have provided is simple and works quite well even though it takes a few steps to setup it does provide a free solution to debug code problems, that could take hours of to solve. Something like monitoring the task states in RTOS would be possible using the STMStudio monitor