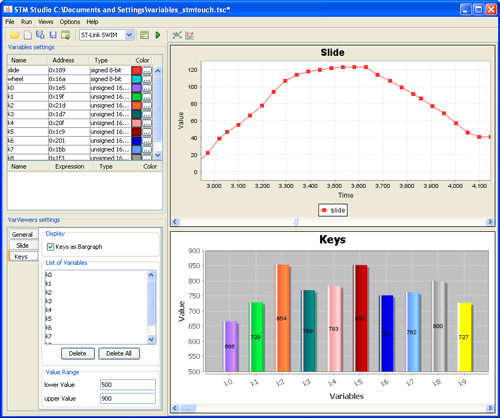
Demonstration program for STM Studio monitor and debug tool.
The ARM Cortex M series supports tracing capabilities through the Serial Wire Debug (SWD) en Serial Wire Output(SWO) port. A simple lib for tracing via SWO is available here. The STM Studio application provided for free by ST has significantly more features. STM Studio is a graphical user interface that allows real-time sampling and visualizing of user's variables while the application is running.

STM Studio is designed to run on PCs with Microsoft Windows operating systems. This tool works with STM32 microcontrollers through JTAG or SWD (serial wire debug) interface. The ST-LINK/v2-1 interface on the mbed nucleo boards can be used with STM Studio. The application code shown here provides an example.
More info is available here
Diff: main.cpp
- Revision:
- 1:fe3e63b1234b
- Parent:
- 0:f3cd9dffaf5e
- Child:
- 4:27fda6f643ad
--- a/main.cpp	Mon Mar 14 20:34:05 2016 +0000
+++ b/main.cpp	Mon Mar 14 20:38:49 2016 +0000
@@ -1,4 +1,4 @@
-/* mbed Test program for debug and monitoring of ST nucleo boards with STMstudio.
+/* mbed Test program for debug and monitoring of ST nucleo boards with STM Studio.
  * Copyright (c) 2016, v01: WH, Initial version
  *
  * Permission is hereby granted, free of charge, to any person obtaining a copy
@@ -125,7 +125,7 @@
 #if(D_DEBUG == 1)
   pc.printf("CPU SystemCoreClock is %d Hz\r\n", SystemCoreClock);

-//The STMstudio tool can import .elf or .axf files which contain a memory map of all variables used in your code.
+//The STM Studio tool can import .elf or .axf files which contain a memory map of all variables used in your code.
 //However, the mbed online compiler does not generate these files, so instead use the following printf to
 //figure out where the vars that you want to monitor (or manipulate) are located and manually paste their addresses into STMstudio
   pc.printf("i is at 0x%08X\r\n", &i);