Real Time Vehicle Tracking System
2016 Fall GATECH ECE4180 Final Project
Team member: Boa-Lin Lai Samuel Choi
Introduction
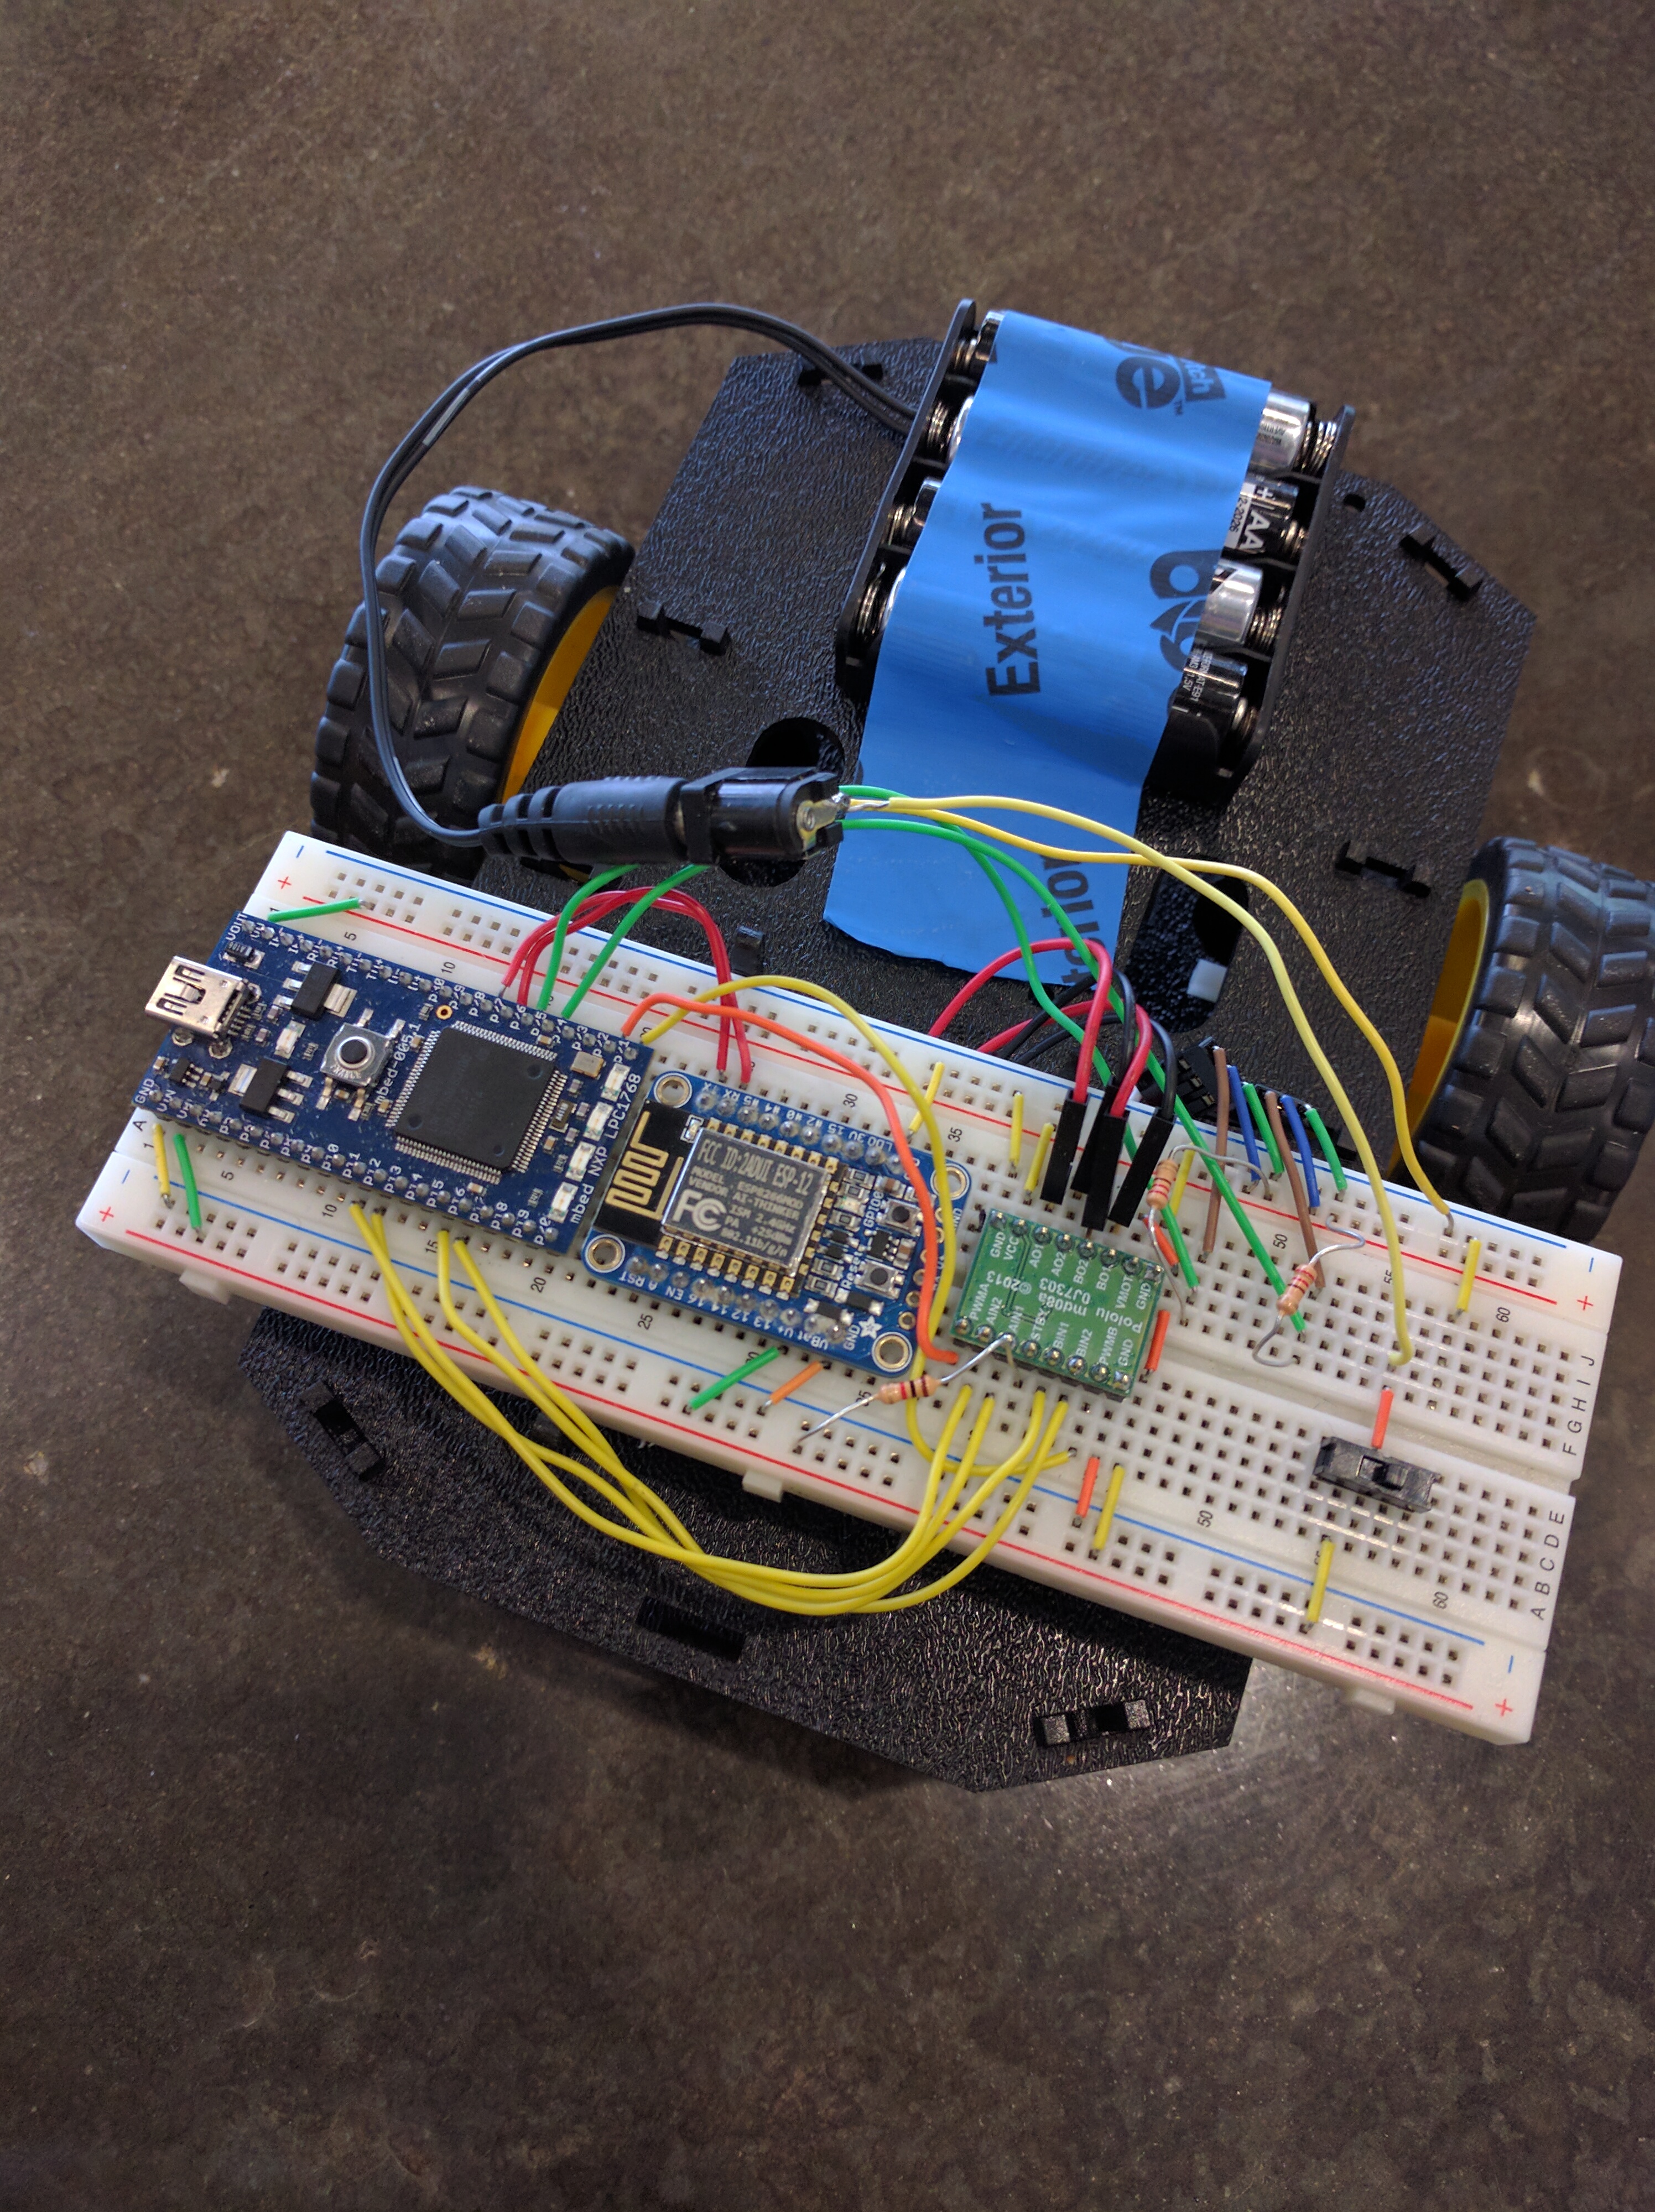
This project design is the backend framework for an autonomous vehicle telemetry system to send instructions and receive coordinates of a vehicle.
Description
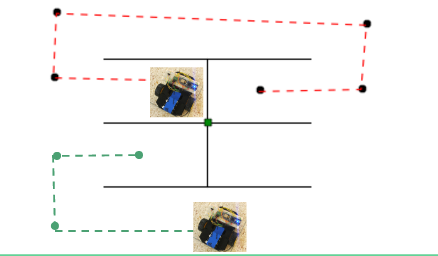
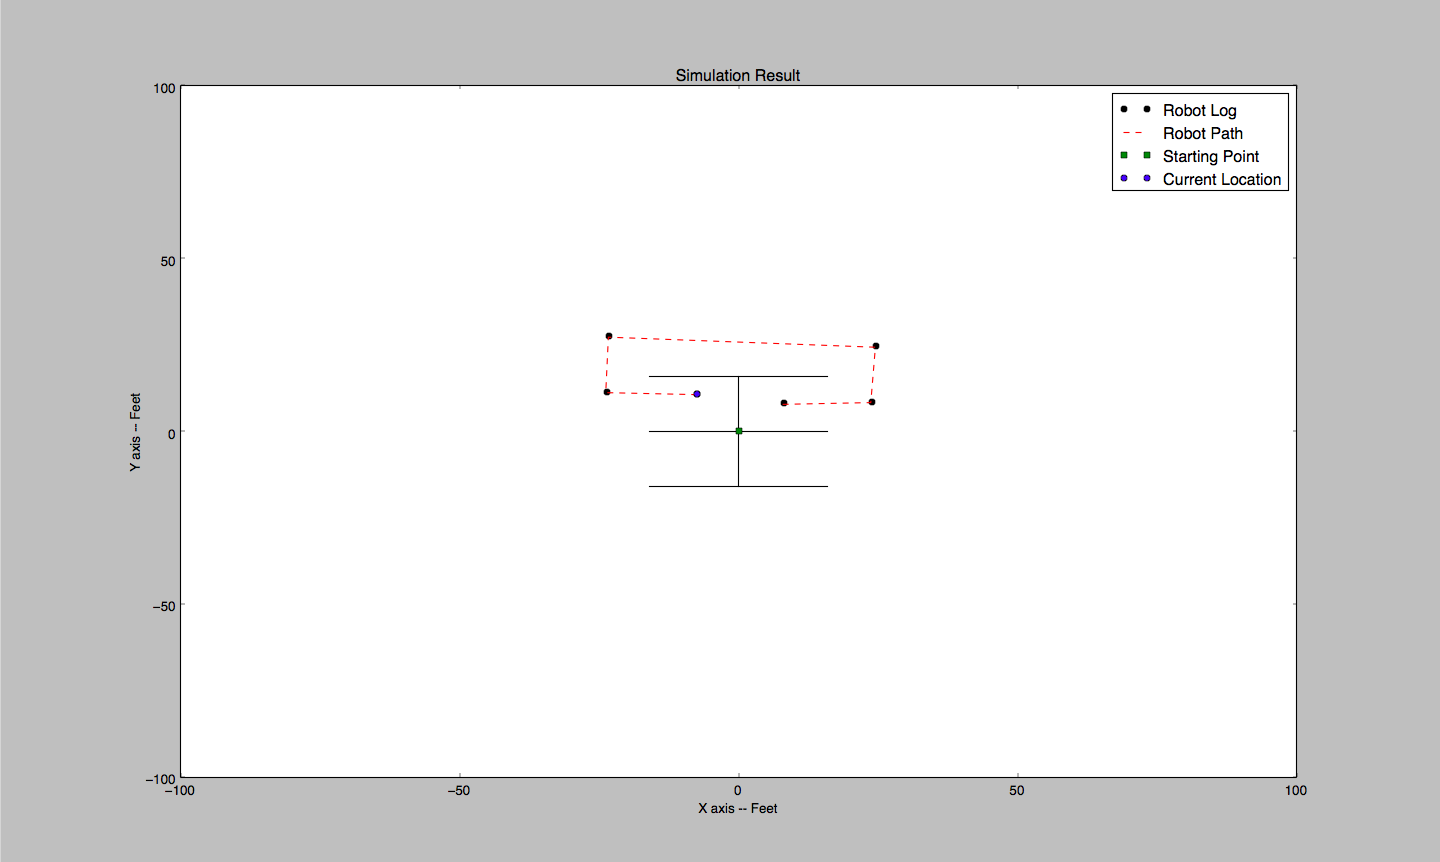
The intent for this project is to simulate the backend telemetry system for an autonomous vehicle part of a larger autonomous vehicle network. Possible applications include but are not limited to automated airport vehicles, factory vehicles, and more. In such a network, each vehicle would have its own WiFi module, which has its own unique IP address, and would communicate using the address with the main controlling computer. Likewise, our robot has its own WiFi module, and our controlling computer was a laptop running a Python program. Once the robot and the laptop are on the same network, the computer is able to send instructions to the robot, and the robot will update its coordinates live to the computer when in motion to update its telemetry graph. The robot gets its coordinates by calculating its directional vector and entering it into a rotation matrix to calculate the next x,y location. The tracking we used reflects the path the robot traveled with good precision.
System Diagram

Each robot has 2 encodes for both wheels. The difference between them can be used to calculate the current robot location. Wifi modules is used for receiving data from python client and create an http server to put the real time data. The python client can parse the log data from the server, but also send the command to the robot.
Hardware
- mbed LPC1768
- Encoders
- ESP 8266 WIFI modules
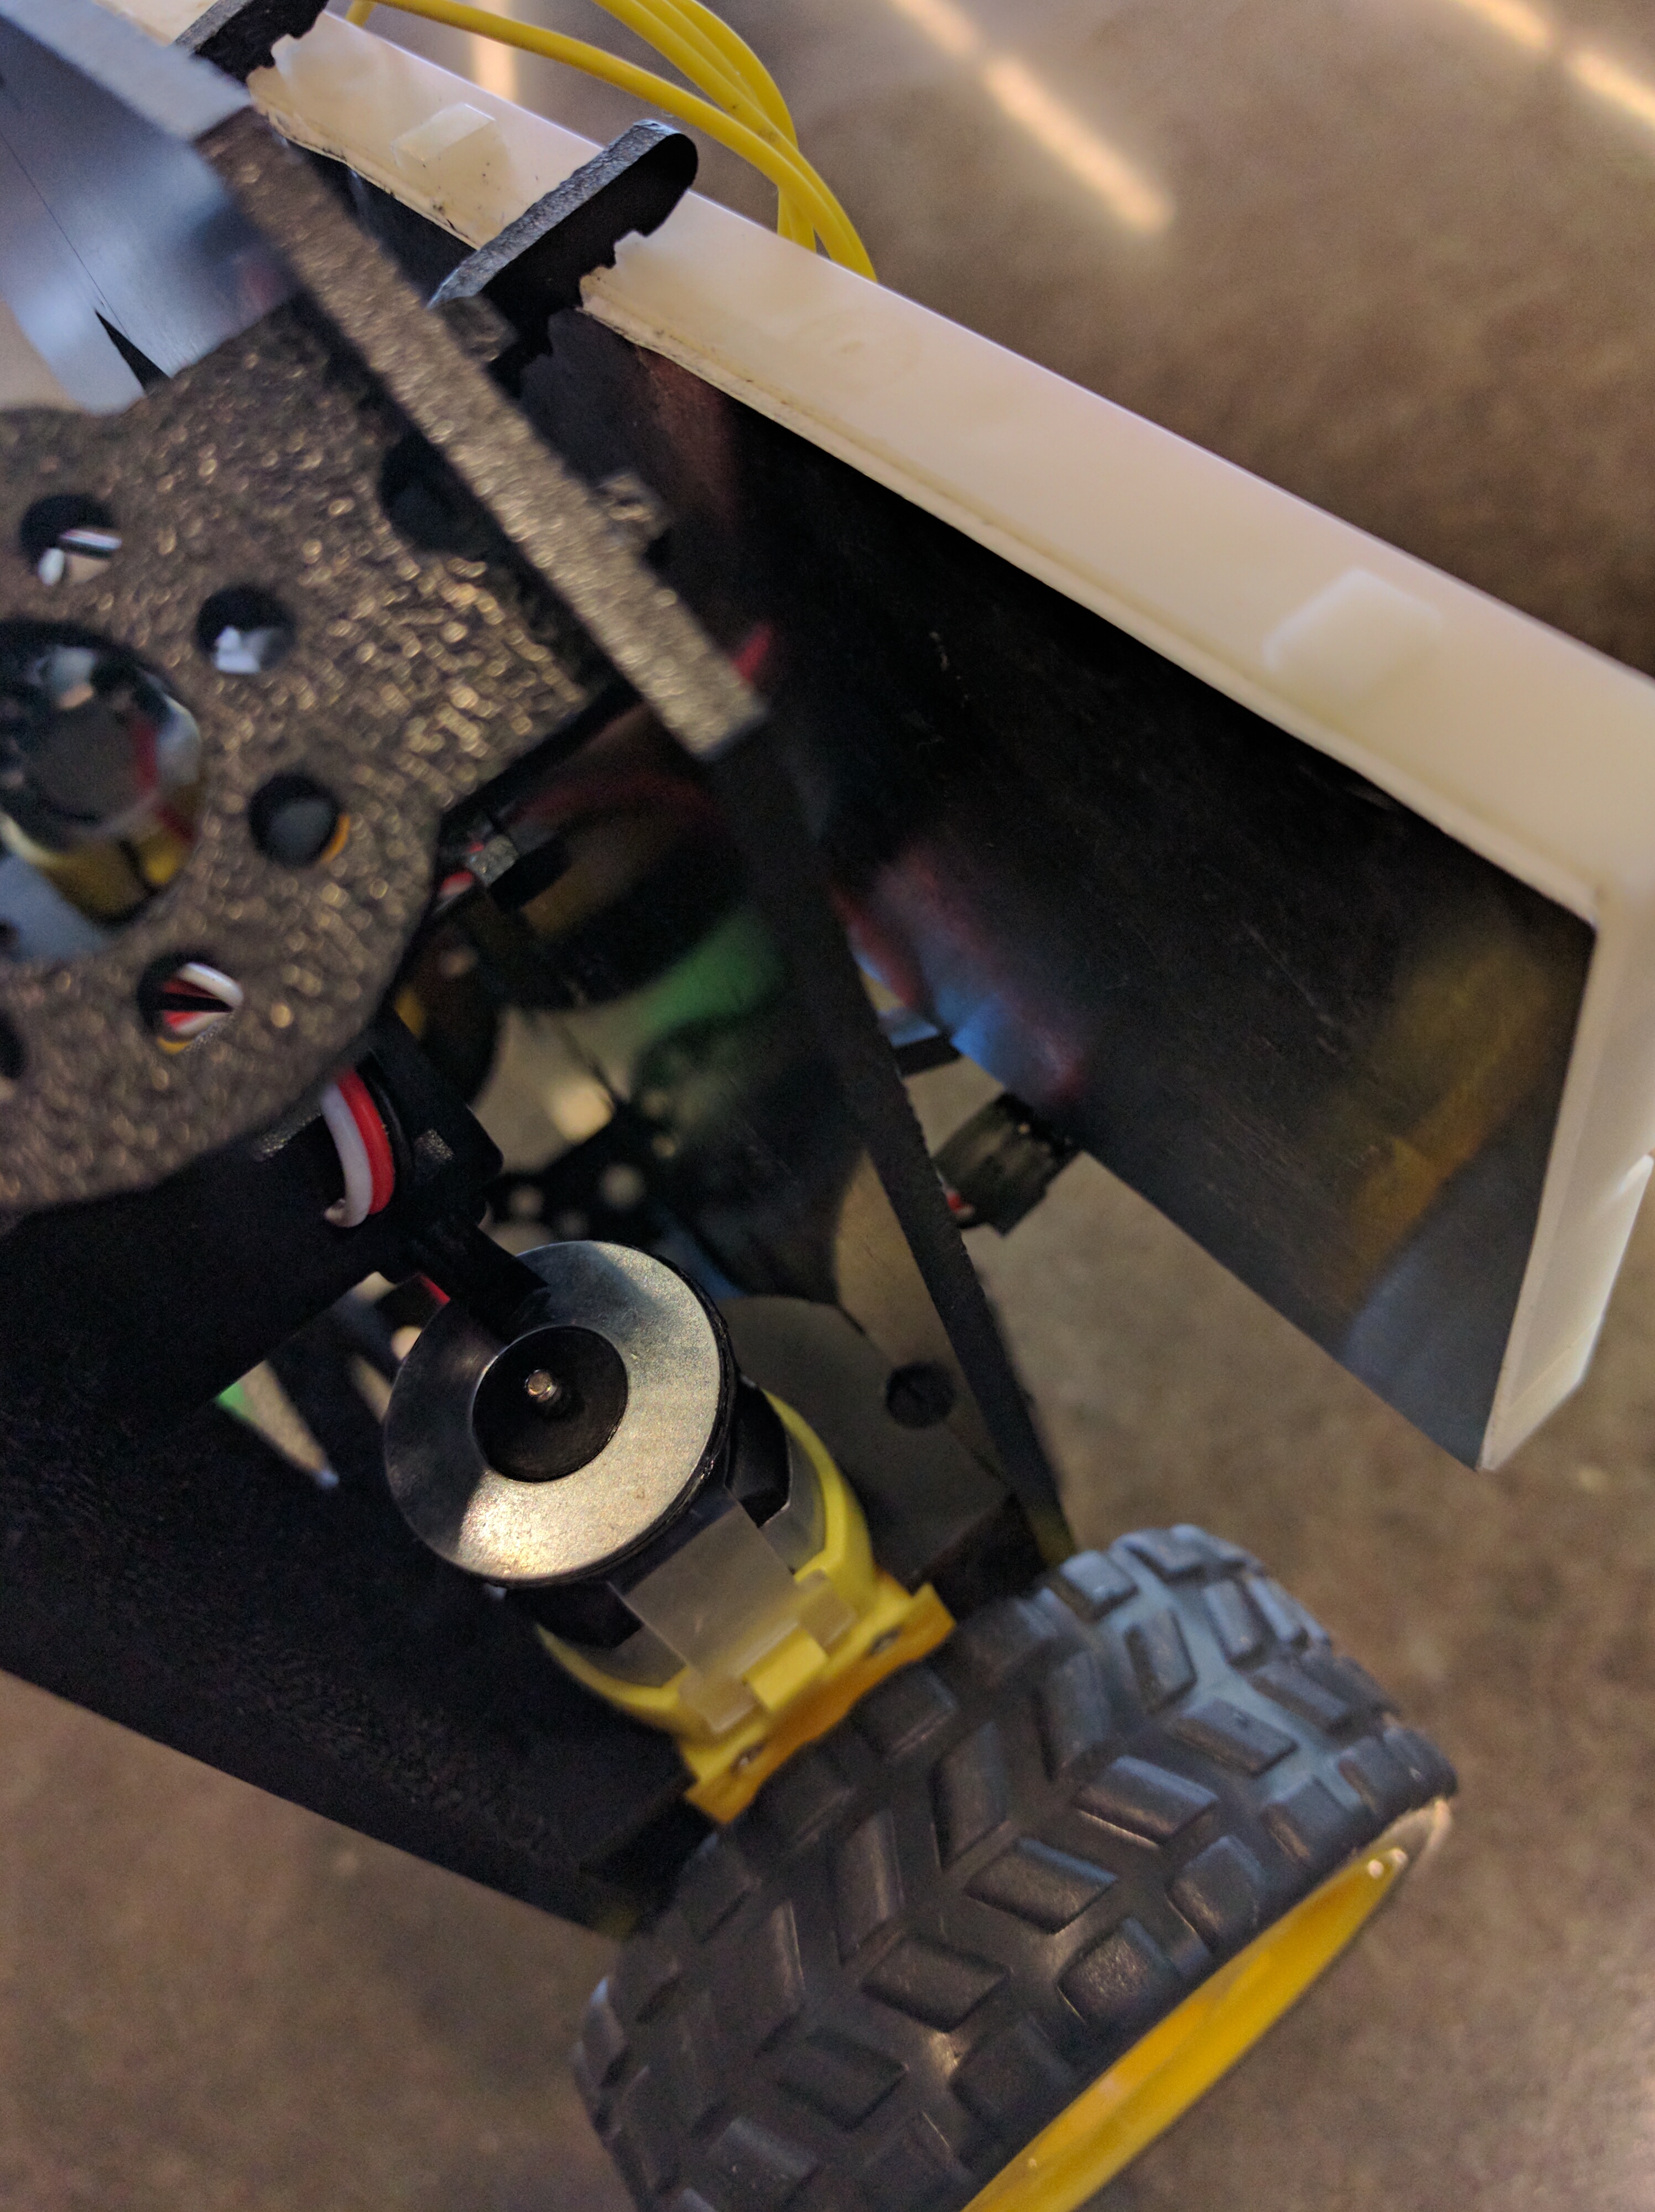
- Shadow Robot frame
- Motors
Positioning Algorithm
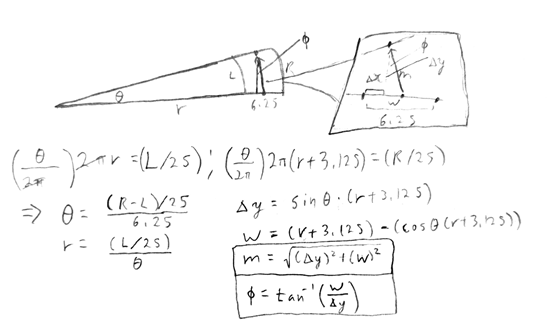
For calculating the robot coordinates, we used data from the wheel encoders and an algorithm to calculate the robot’s position. We discovered that 25 ticks is about 1 inch and that the width of the robot from wheel center to wheel center was 6.25 inches. In the shown image, you can see that the angle theta is part of arcs L and R, with L and R representing the left and right wheel ticks respectively. We divide L and R by 25 every time to convert the ticks into inches. We can derive theta and the radius with the equations shown in the picture. However, what we are looking for is the distance from the point in between the wheels from the bottom of the angle to the top of the angle, so the distance is the magnitude m and the angle of that line is phi with respect to the line on theta = 0. We calculate m by calculating the sin and cos of r+3.25, because that is the center of the wheel at the angle of theta. Once we have m, we can find phi. With m and phi, we can add the sin and cos of phi times the magnitude m, add the cos result to x and sin result to y to get the new coordinates.
Pin Assignment
| Mbed | Device | Device Pin | Device 2 | Device 2 Pin |
|---|---|---|---|---|
| GND | External Power | GND Terminal | ||
| VIN | External Power | High Pin | ||
| P11 | H-Bridge | AIN2 | ||
| P12 | H-Bridge | AIN1 | ||
| P15 | H-Bridge | BIN1 | ||
| P16 | H-Bridge | BIN2 | ||
| P21 | H-Bridge | PWMB | ||
| P22 | H-Bridge | PWMA | ||
| H-Bridge | AO1 | Motor1 | High | |
| H-Bridge | AO2 | Motor1 | Low | |
| H-Bridge | BO2 | Motor2 | High | |
| H-Bridge | BO1 | Motor2 | Low | |
| H-Bridge | STBY | Pull Up | VIN | |
| GND | H-Bridge | GND x3 | ||
| VOUT | H-Bridge | VCC | ||
| VIN | H-Bridge | VMOT | ||
| P25 | R Encoder | Analog Out | ||
| GND | R Encoder | GND | ||
| VOUT | R Encoder | VCC | ||
| P26 | L Encoder | Analog Out | ||
| GND | L Encoder | GND | ||
| VOUT | L Encoder | VCC | ||
| P27 | Huzzah WiFi Module | TX | ||
| P28 | Huzzah WiFi Module | RX | ||
| GND | Huzzah WiFi Module | GND | ||
| VIN | Huzzah WiFi Module | V+ |
Main Program
Import programRT_Wifi_system
ECE4180 final project
Python Interface
For using this python script, we need to do the followings steps
- List Find out the robot's IP address on change it in the script.
- Create the specific movement for robot in cmdlist
- 1 is left turn, 2 is right turn. each alphabet represents a distance unit.
RT_parse_cmd.py
# ECE 4180
# FINAL PROJECT
# ParseWeb version 1.0
# Author: Boa-Lin Lai
import math
import matplotlib.pyplot as plt
import time
import sys
from lxml import html
import urllib2
import select
serverUrl = "http://0.0.0.0" # change the address for esp8266
"""
  This file will parse the data from ESP8266 and plot the points in real time
"""
def parseWeb():
  """
   This module is used to get the data points from ECE2031 server
  """
  response = urllib2.urlopen(serverUrl)
  html = response.read()
  xPoints = []  # list for robot x points
  yPoints = []  # list for robot y points
  xDesPoints = [] # list for destination x points
  yDesPoints = [] # list for destination y ponins
  # this line should be changed for starting trigger.
  strparse = "<p>";
  html = html.split(strparse)[-1];
  strparse = "</p>";
  html = html.split(strparse)[0];
  for line in html.split('<br>'):
    if line is not "":
      points = line.split(',')
      print points
      x = float(points[0])
      y = float(points[1])
      xPoints.append(x)
      yPoints.append(y)
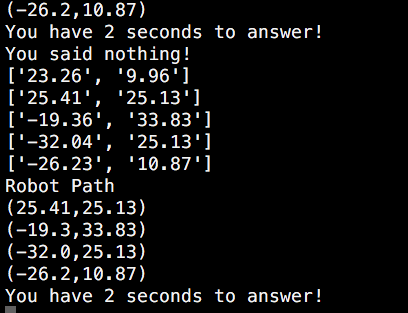
  print "Robot Path"
  for i in range(1, len(xPoints)):
    print '(' + str(xPoints[i])[:5] + ',' + str(yPoints[i])[:5] + ')'
  return xPoints, yPoints

def printTerminal():
  plt.subplot(121)
  plt.plot([-16, 16], [-16,-16], 'k-')
  plt.plot([-16, 16], [0,0], 'k-')
  plt.plot([-16, 16], [16,16], 'k-')
  plt.plot([0, 0], [-16,16], 'k-')
  plt.xlabel("X axis -- inch")
  plt.ylabel("Y axis -- inch")
  plt.title("Terminal Outline")
  axes = plt.gca()
  axes.set_xlim([-500,500])
  axes.set_ylim([-500,500])
  plt.show()
def printResult(dataX, dataY):
  """
    This module will initialize the point on the canvas
  """
  plt.clf()
  plt.plot([-16, 16], [-16,-16], 'k-')
  plt.plot([-16, 16], [0,0], 'k-')
  plt.plot([-16, 16], [16,16], 'k-')
  plt.plot([0, 0], [-16,16], 'k-')
  plt.plot(dataX, dataY, 'ko', label = "Robot Log")
  plt.plot(dataX, dataY, 'r--', label = "Robot Path")
  plt.plot(0,0, 'gs', label = "Starting Point")
  plt.plot(dataX[-1],dataY[-1], 'bo', label = "Current Location")
  plt.legend(loc='best')
if __name__ == "__main__":
  """
    main funciton for parseWeb
  """
  plt.ion()
  plt.grid()
  fName = "points.txt"
  ans = ""
  gl_dataX = [8];
  gl_dataY = [8];
  cmdlist = {};
  cmdlist['B'] = "b1b1d1b1b1" # cmdlist, it can be extended
  cmdlist['b'] = ""
  while(ans != "q"):
    dataX, dataY= parseWeb()
    if dataX and not gl_dataX[-1] == dataX[-1] and not gl_dataY[-1] == dataY[-1]:
      gl_dataX = [8];
      gl_dataY = [8];
      gl_dataX.extend(dataX);
      gl_dataY.extend(dataY)
    printResult(gl_dataX, gl_dataY)
    plt.xlabel("X axis -- Feet")
    plt.ylabel("Y axis -- Feet")
    plt.title("Simulation Result")
    axes = plt.gca()
    axes.set_xlim([-100,100])
    axes.set_ylim([-100,100])
    print "You have 2 seconds to answer!"
    i, o, e = select.select( [sys.stdin], [], [], 2)
    # 2 second respond time
    if (i):
       ans =  sys.stdin.readline().strip()
       print "You said " + ans
    else:
       print "You said nothing!"
    if ans == "s":
      plt.savefig("result.ps")
    if ans is not "":
      print "send  " + cmdlist[ans]
      urllib2.urlopen(serverUrl,"CMDSTART" + cmdlist[ans] + "CMDEND")
      # send the post data to wifi module
    ans = ""
    plt.pause(0.5)
Demo Video
Further Enhancement
- Tweaking python scripts for tracking multiple vehicles
- Finding a way to overcome the http buffer limit. For the http server there is a buffer limit, finding a more efficient way to compress data will allow the plot to be more precise.
Gallerys
Please log in to post comments.
