Important changes to forums and questions
All forums and questions are now archived. To start a new conversation or read the latest updates go to forums.mbed.com.
6 years, 8 months ago.
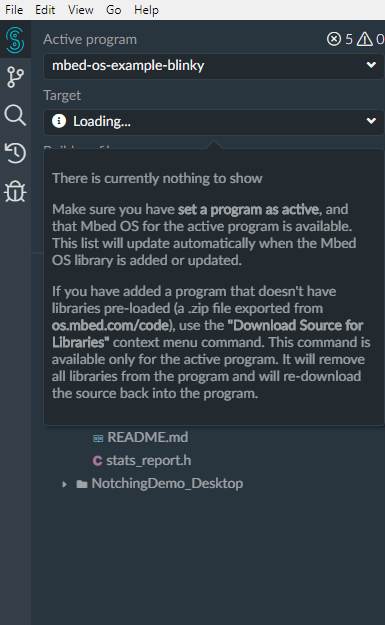
Mbed Studio Target's dropdown broken
I installed Mbed Studio for the first time thinking: "Great! perhaps I will now actually be able to use a debugging tool".
However I think this image says it all:

I have set the project as active, and I have also tried plugging my lpc1768 board into the p.c., to try and get it to be auto-detected, but with no success.
Does anybody know how to solve this issue? I have already posted a discussion here and sent this question to mbed support, and have had no input.
Question relating to:
1 Answer
6 years, 8 months ago.
Hi Rory,
Apologies for keeping your question unanswered for that long. Would you mind sending us logs? That will help us a lot in finding out where the problem may be on your system. To send logs please open Mbed Studio and go into:
Menu => Help => Report an Issue
We will soon release a new version of Mbed Studio 0.6.0. It contains significant improvements/fixes in targets management.
Kind Regards Arek Zaluski
Hi Arek - thanks for the reply. I will be away Saturday and Sunday so I will try to generate logs on Sunday night.
Best Regards,
Rory
posted by 31 Aug 2019Hi Arek, I have tried as you have suggested. When I have clicked "Report and Issue", it comes up with a dialog box saying "To help us improve Mbed studio, please attach a log file when reporting an issue." I then have an option to view the log file and also to "Report and Issue". When I click the Report and Issue button, it takes me to my browser, but only the google homepage. I am going to try sending you the log file by email.
I have seen something on one of the mbed pages before saying that the report an issue link doesn't work, I am a bit surprised that is still the case!
posted by 01 Sep 2019Hi Arek. I was just wondering if there was any update on sorting this issue? Or perhaps on when the next version of mbed studio will be released?
Cheers and Many thanks,
Rory
posted by 14 Sep 2019Hi Arek
I tried uninstalling mbed studio, redownloading it from the website, and then installing it again.
The targets issue has now been resolved. I can now get mbed studio to auto-detect my LPC1768 board. It would have been nice though to have received a reply from mbed informing me that this had been fixed, as I have heard nothing in 2 weeks.
However I CANNOT debug. If I click run, the entire program builds and (presumably?) runs, past my breakpoints.
I have seen on this page: https://os.mbed.com/docs/mbed-studio/0.5/introduction/known-issues.html that due to a known bug, if i put in breakpoints, I have to disable them, and then enable them again, to make them work.
However, when ever I right click on a breakpoint and click "disable breakpoint", nothing happens. So therefore I cannot perform the fix as suggested in the above link.
Please advise.
cheers
Rory
posted by 16 Sep 2019Since the comment immediately above, I have then closed mbed studio and then reopened it. I have not had the same issue again, but a different one. Now when I right click on a breakpoint, it does not have any options to enable or disable. It simply has the following options:
"Add Breakpoint" "Add Conditional Breakpoint" "Add Logpoint"
any thoughts?
posted by 16 Sep 2019