Visual Studio Code
This document explains how to build and debug Arm Mbed OS applications using Visual Studio Code. Before starting, first configure your local debug toolchain.
Also install GNU Make or Mbed CLI to build the project.
Installing Visual Studio Code
You need to install Visual Studio Code with the C/C++ extensions to begin.
-
Install Visual Studio Code.
-
Open Visual Studio Code, and click on the Extensions button.
-
Search for the C/C++ plugin (by Microsoft) and click Install.
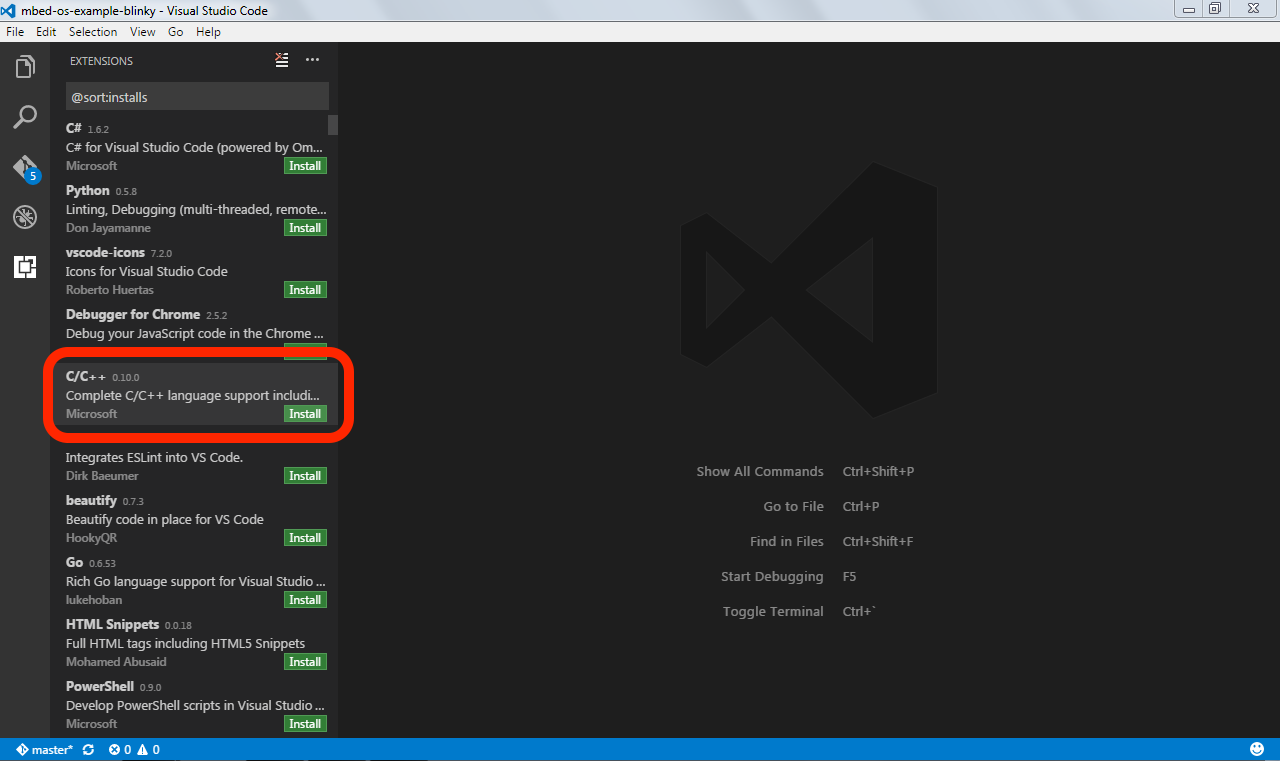 Installing the C/C++ plugin in Visual Studio Code
 -
When prompted, restart the IDE.
Exporting a project
To export your project to Visual Studio Code, you can use either the Online Compiler or Arm Mbed CLI.
Online Compiler
-
Right click on your project.
-
Select Export Program....
-
Under Export toolchain, select Visual Studio Code (GCC ARM).
Tip: For most targets, you can also export to ARMCC.
-
Click Export, and unpack at a convenient location.
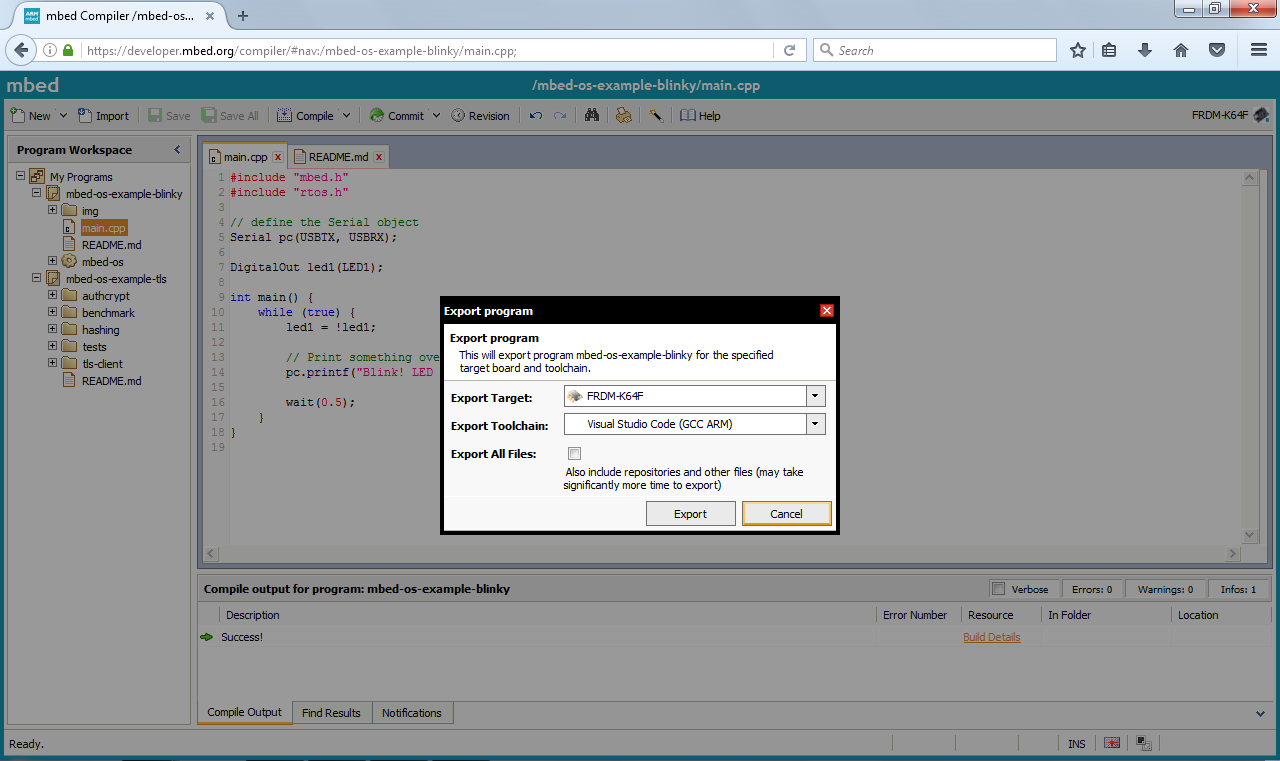 Exporting to Visual Studio Code
Arm Mbed CLI
In your project folder, run:
## alternatively, use -i vscode_armc5 for ARMCC, or -i vscode_iar for IAR
## replace K64F with your target board

$ mbed export -i vscode_gcc_arm -m K64F --profile debug
Configuring the debugger
To configure the debugger for your project:
-
Open the folder in Visual Studio Code.
-
Open the
.vscode/launch.jsonfile. -
If you're using pyOCD as your debug server, verify that
debugServerPathis set to the location ofpyocd-gdbserver. -
If you're using OpenOCD as your debug server:
- Change
debugServerPathto point to the location ofopenocd. - Change
debugServerArgsto include your OpenOCD arguments. For more info, read our toolchain document.
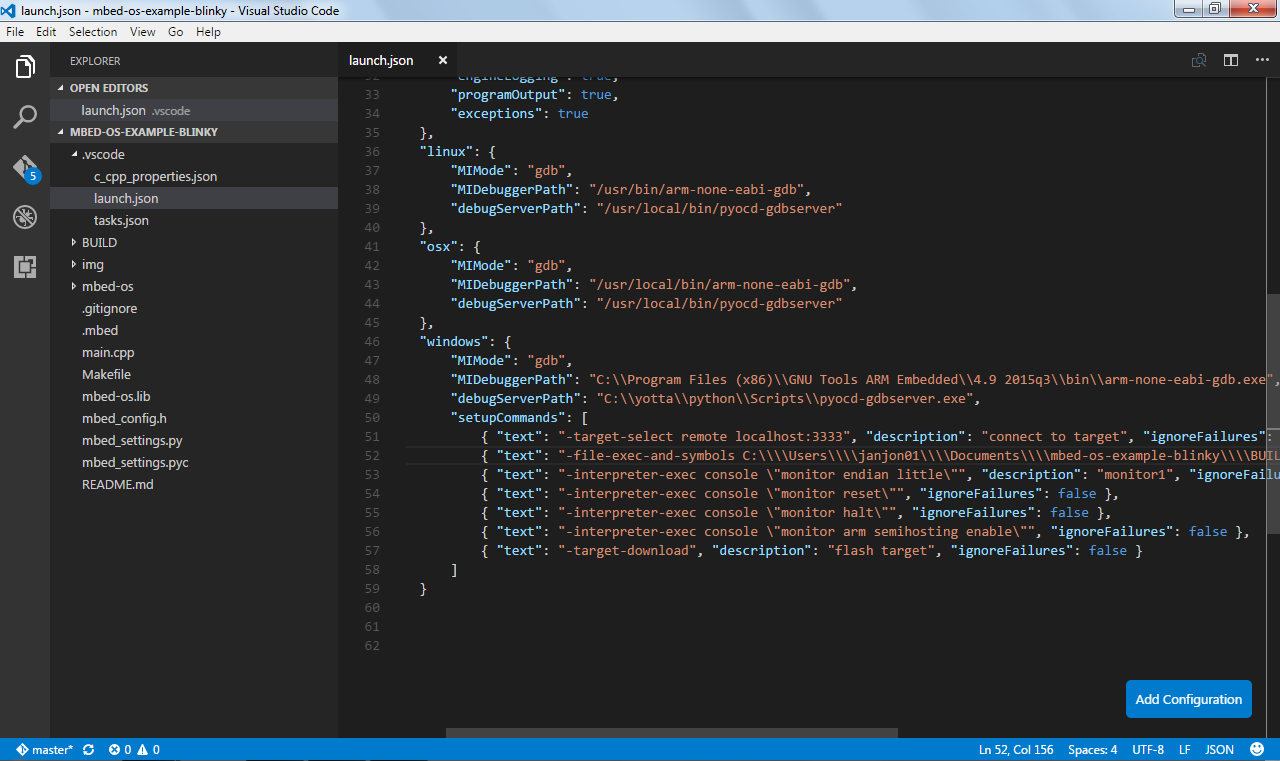 Configuring the debugger
 - Change
Note: If you installed the GNU Arm Embedded Toolchain in a nondefault location (for example, through the Arm Mbed CLI installer), you need to update the MIDebuggerPath to the full path of your copy of arm-none-eabi-gdb. To find the new path, open a terminal, and run where arm-none-eabi-gdb (Windows) or which arm-none-eabi-gdb (macOS and Linux).
Debugging your project
-
On the Debug tab, click the Play icon.
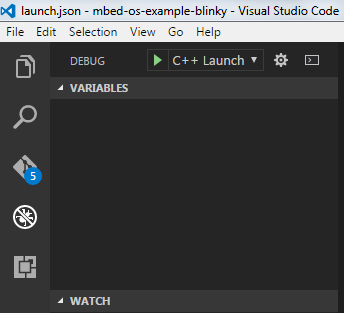 Starting the debug session
 -
The project builds, and debugging starts when the build succeeds.
-
To see warnings or errors, select View > Problems.
-
Click on Debug Console to see the debug output (this is not activated automatically).
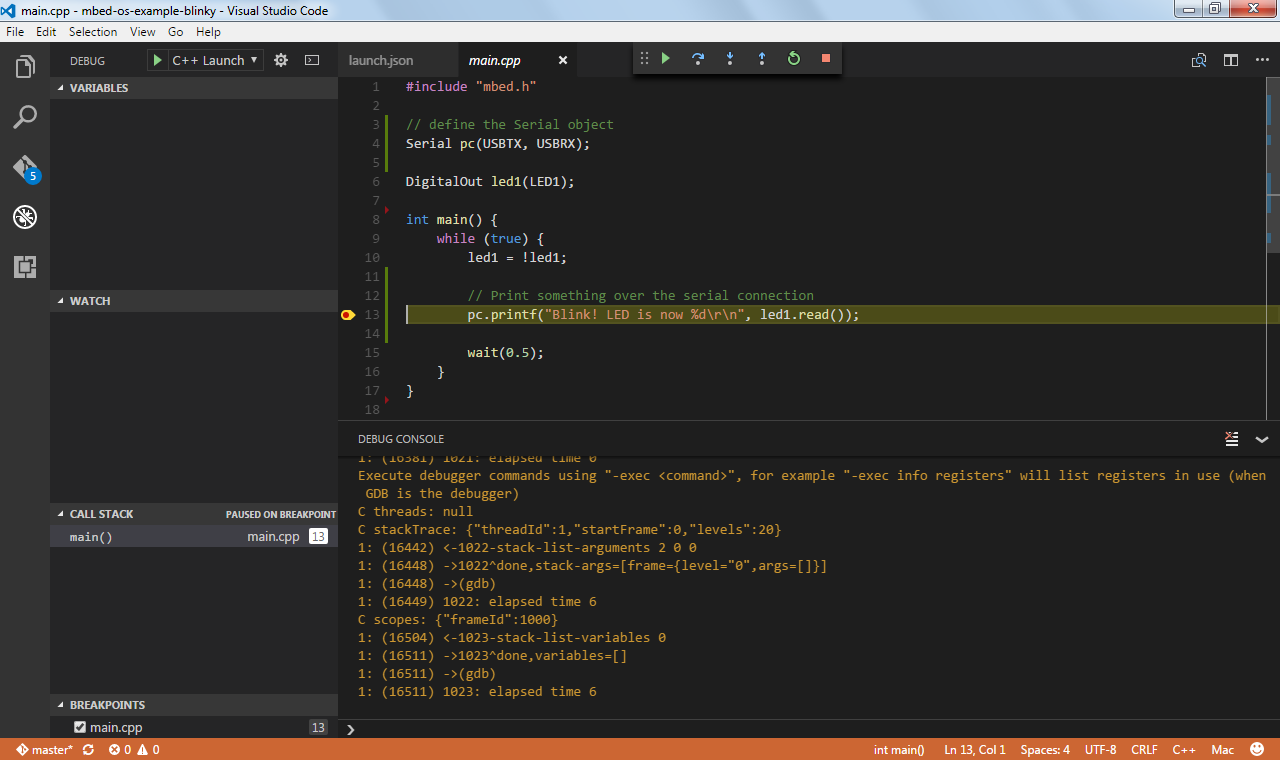 Running the debugger
Tip: You can use the Debug Console to interact with the device over GDB and use functionality the UI does not expose. For example, to see the registers, type -exec info registers. To put a watch on a memory location, type -exec watch *0xdeadbeef.
Building with Mbed CLI
Visual Studio Code uses make to build your application by default. You can also build with Mbed CLI. To do this:
-
In
.vscode/tasks.json, replace the four instances ofmakewithmbed. -
In
.vscode/tasks.json, changeargsto:"args": ["compile", "--profile=debug", "-t", "GCC_ARM", "-m", "YOUR_TARGET"], -
In
.vscode/launch.json, replace both instances ofmakewithmbed. -
In
.vscode/launch.json, change${workspaceRoot}/BUILD/(twice) to${workspaceRoot}/BUILD/YOUR_TARGET/GCC_ARM/. -
In
.vscode/launch.json, change${workspaceRoot}\\BUILDto${workspaceRoot}\\BUILD\\YOUR_TARGET\\GCC_ARM.