Debugging the quick start
Using printf
The easiest way to do basic debugging is to use the printf command in your code, then read the output using a serial terminal, such as PuTTY or CoolTerm.
For example, add printf("Hello World!\n\r"); to the top of your main function, and then recompile the program and flash it to your device.
Note: Unless otherwise specified, printf defaults to a baud rate of 9600 on Mbed OS. You can modify this value in the mbed_app.json file. To configure your terminal client to this baud rate, change the speed option when selecting the port. You can view the configuration options page to learn more about how to configure OS-level options.
To determine which communication port your board connects to:
-
On Windows:
- Open the Device Manager by pressing
Windows key +R . - Enter
devmgmt.msc. - Click OK.
- Under Ports (COM & LPT): your Mbed board is listed as a
USB Serial Devicenext to its COM port.
- Open the Device Manager by pressing
-
On Linux: Run
dmesg | grep ttyfrom your command-line. -
On macOS: Run
ls /dev/tty.*from your command-line.
Exporting to a desktop IDE
To debug using a desktop IDE such as Keil uVision, IAR or Eclipse:
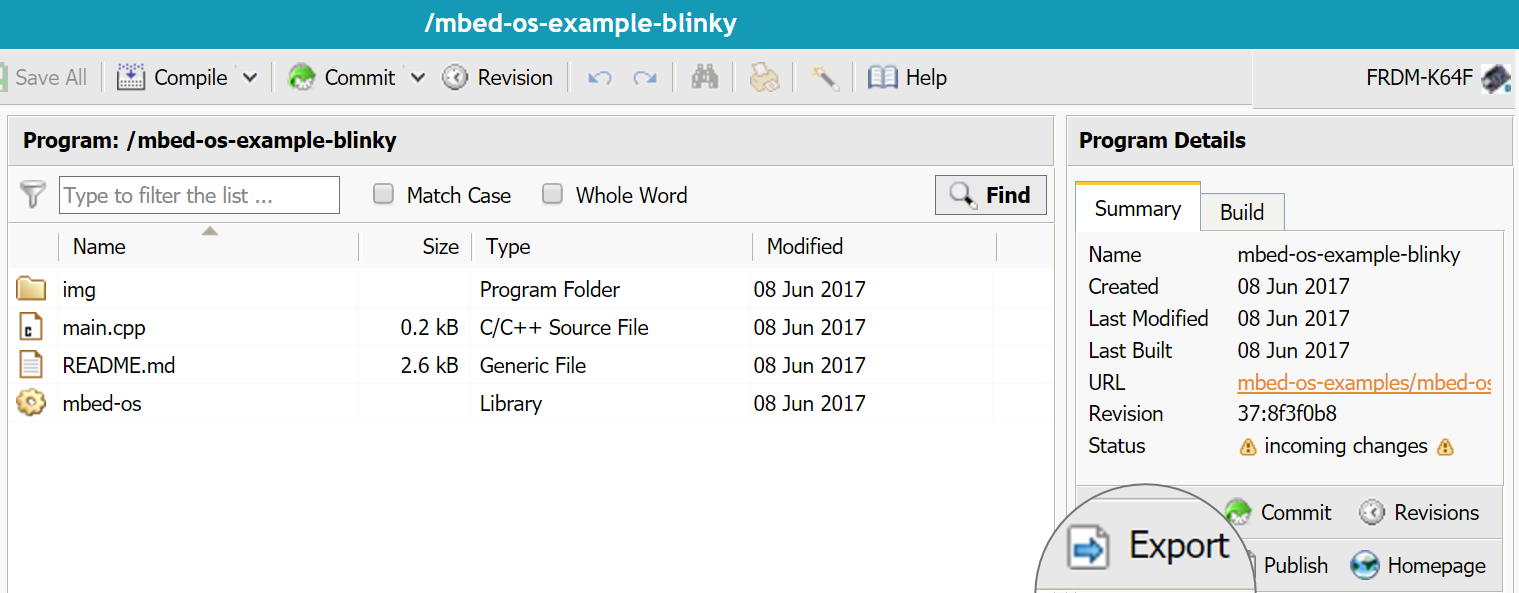
- Under Program Details, click the Export button.
- Select your export platform and IDE.
- Click Export.
- Your browser downloads a
.zipfile with the project files.
