How to debug with e2 studio
Environment
Builder: Mbed CLI or Mbed Studio(version1.2.0)
Toolchain: GNU ARM Embedded Toolchain(version 9) or ARM C Compiler (version 6.14)
Debugger: Renesas e2 studio
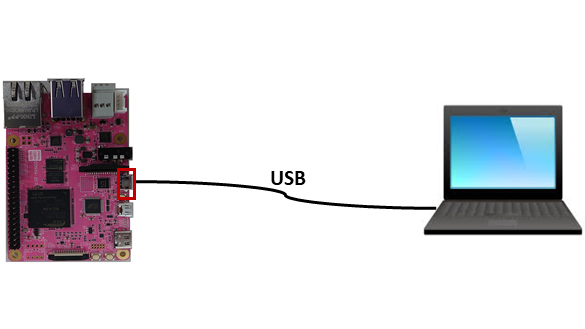
Setup Procedure
Install e2 studio
Please download e2studio 7.8.0 or 2020-07, and install.
Install OpenOCD
Please download exe file of OpenOCD v0.10.0-201601101000-dev, and install.
Associate GR-MANGO config with OpenOCD
Please download renesas_gr.cfg and copy it to scripts\board directory included in the OpenOCD installed location.
According to the version of the windows operating system and the version of OpenOCD, it should be located as follows:
Windows OS(32bit), OpenOCD(32bit):
・C:\Program Files\GNU ARM Eclipse\OpenOCD\0.10.0-201601101000-dev\scripts\board
Windows OS(64bit), OpenOCD(32bit):
・C:\Program Files (x86)\GNU ARM Eclipse\OpenOCD\0.10.0-201601101000-dev\scripts\board
Windows OS(64bit), OpenOCD(64bit):
・ C:\Program Files\GNU ARM Eclipse\OpenOCD\0.10.0-201601101000-dev\scripts\board
Install OpenOCD add-in to e2studio
- Launch e2studio.
- Select[Help]menu→[Install new software...]
- Input
http://gnuarmeclipse.sourceforge.net/updatesto [Work with] box, and click [Add] button.
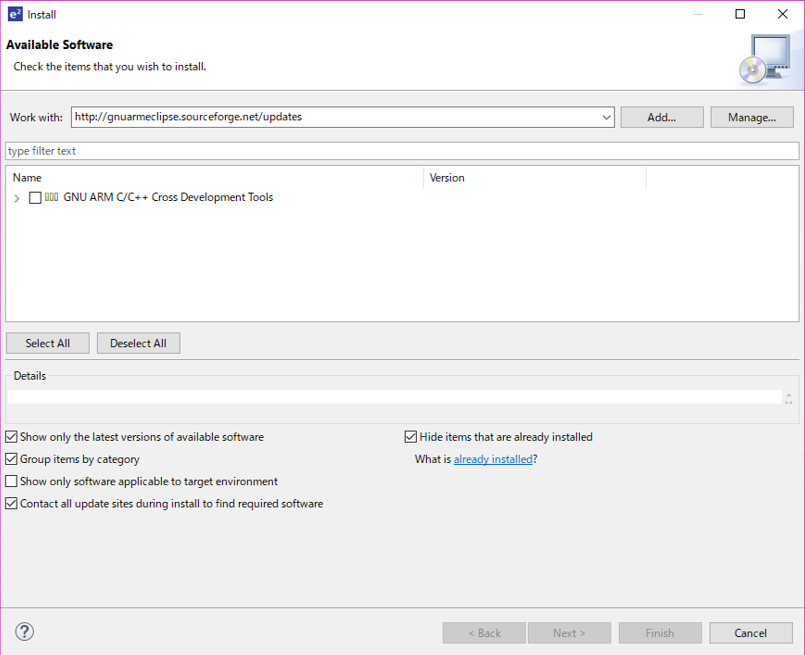
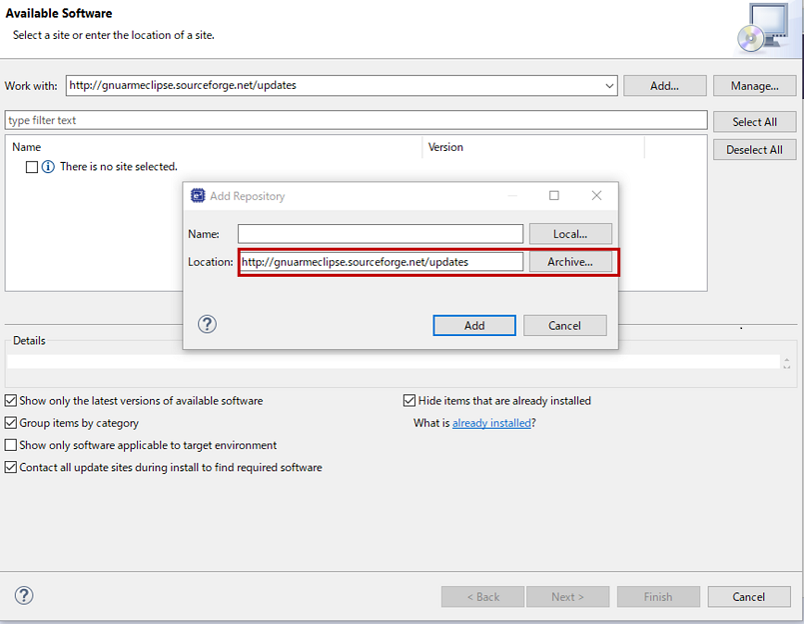
- A window will pop up and the
http://gnuarmeclipse.sourceforge.net/updatesis placed in the [Location] box automatically. Click add button.
- Check [GNU ARM C/C++ OpenOCD Debugging] and push [Next >] button.
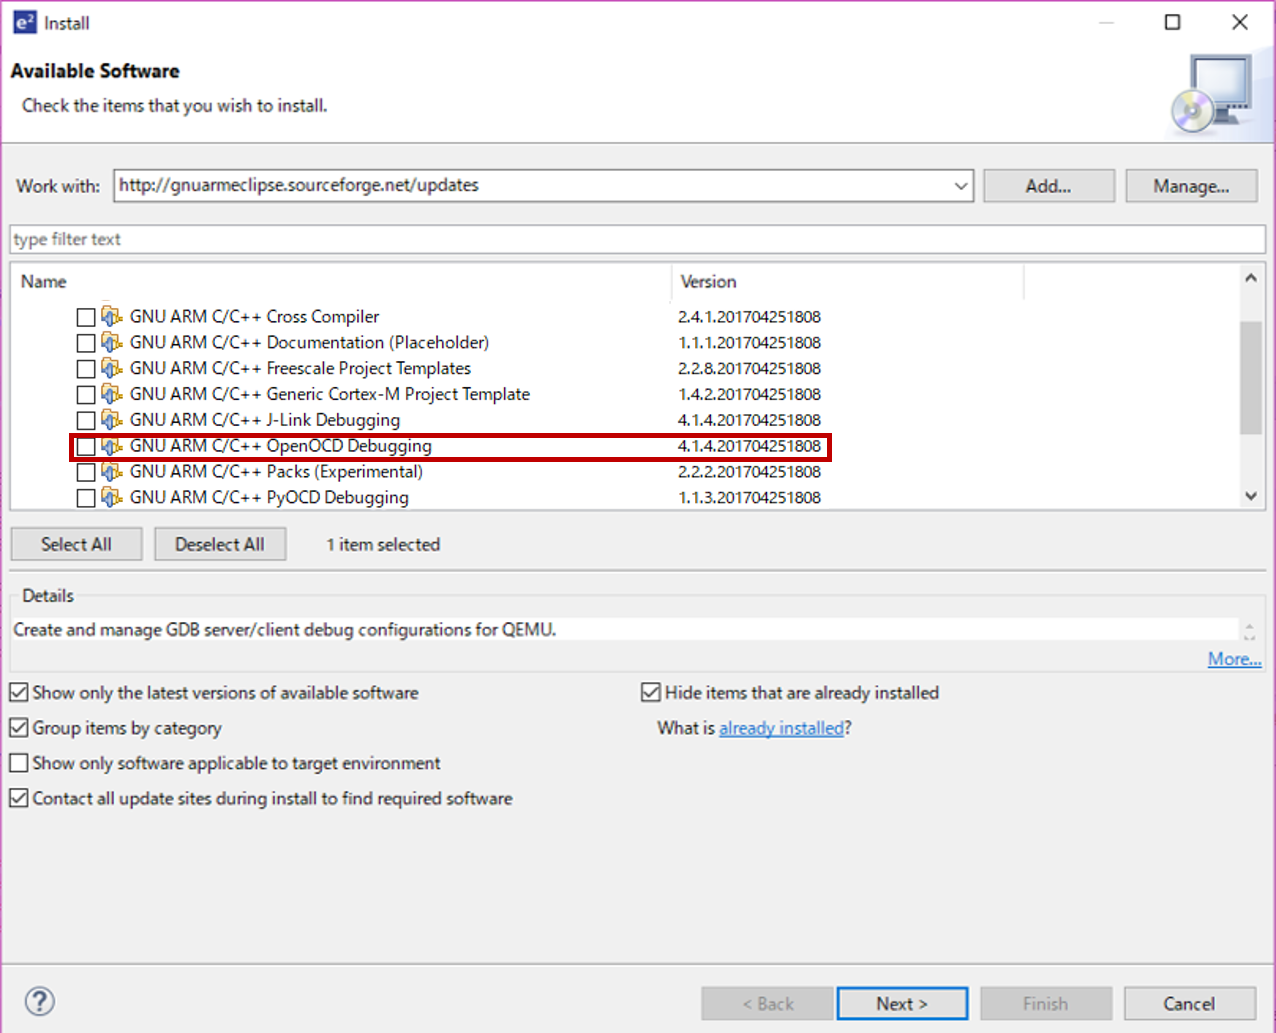
- Install and restart e2studio.
Configure OpenOCD on e2studio
- Select [Window] -> [Preferences].
- Select [MCU] - [Global OpenOCD Path].
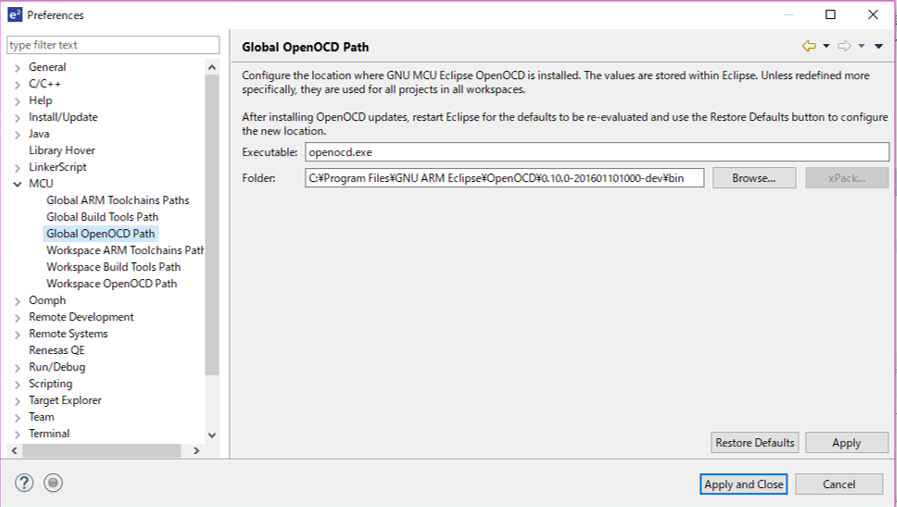
- Check if the directory and executable are filled with OpenOCD installation folder and openocd.ex respectively. If not, please input OpenOCD installation folder and openocd.exe there and click [OK]. Note that the default OpenOCD installation folder should be as follows:
- Windows OS(32bit), OpenOCD(32bit):
・C:\Program Files\GNU ARM Eclipse\OpenOCD\0.10.0-201601101000-dev\bin
- Windows OS(64bit), OpenOCD(32bit):
・C:\Program Files (x86)\GNU ARM Eclipse\OpenOCD\0.10.0-201601101000-dev\bin
- Windows OS(64bit), OpenOCD(64bit):
・ C:\Program Files\GNU ARM Eclipse\OpenOCD\0.10.0-201601101000-dev\bin
- Windows OS(32bit), OpenOCD(32bit):
The way to debug
Notice
If there is no ".gdbinit " file in the project folder. (where the .project file exists.)
Please copy the ".gdbinit" file to your project folder and keep the name of the file called ".gdbinit"
.gdbinit
define hook-step
mon cortex_a maskisr on
end

define hook-stepi
mon cortex_a maskisr on
end

define hook-next
mon cortex_a maskisr on
end

define hook-nexti
mon cortex_a maskisr on
end

define hook-finish
mon cortex_a maskisr on
end

define hook-stop
mon cortex_a maskisr off
end

define hook-kill
mon reset init
end

set mem inaccessible-by-default off
- Connect USB cable. Mbed drive will start up.
- Copy ".bin" file to Mbed drive.
- Reconnect USB cable.
- Select project to debug in e2 studio.
- Select [Run] menu ->[Debug Configuration].
- Select [GDB OpenOCD Debugging] , then right click it and choose "New Configuration".
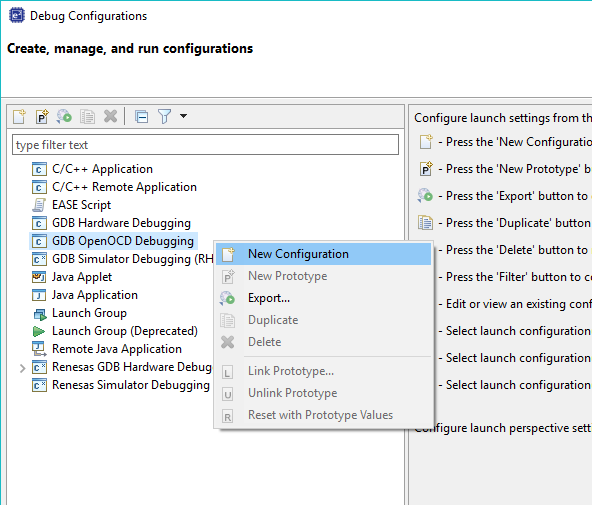
- Select your project in [GDB OpenOCD Debugging]
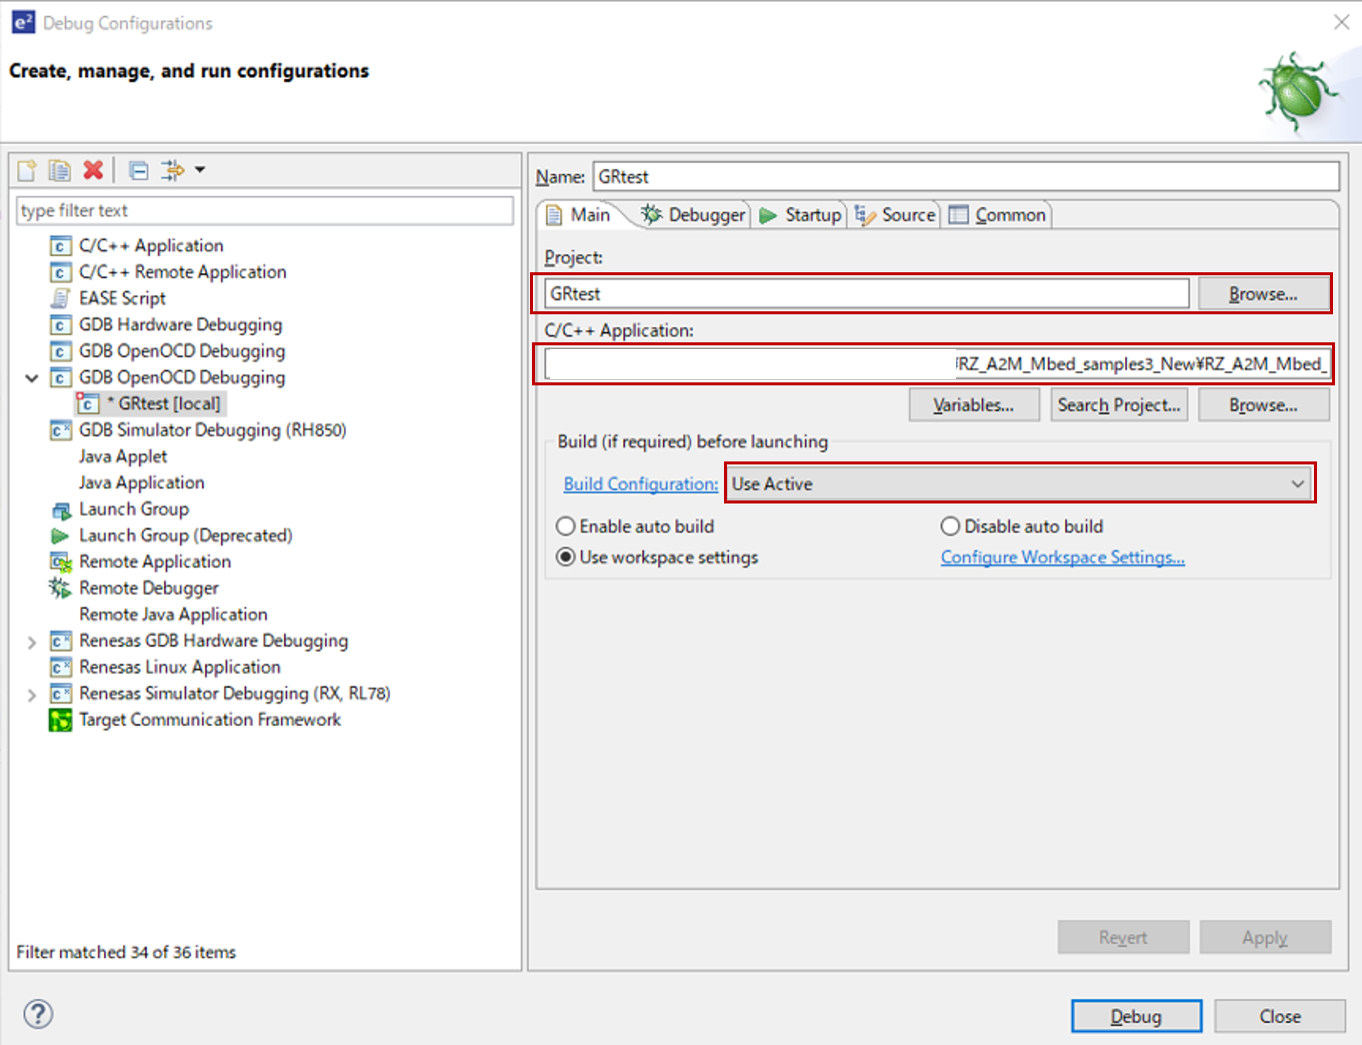
- In the [Main] tab, please write the applicable project name in"Project" and the applicable elf file path in "C/C++ Application". Select "Use Active" in the build configuration.
- In the [Debugger] tab, write <-f board/renesas_gr.cfg> in "Config options".
"arm-none-eabi-gdb" is described in GDB Client Setup "Executable".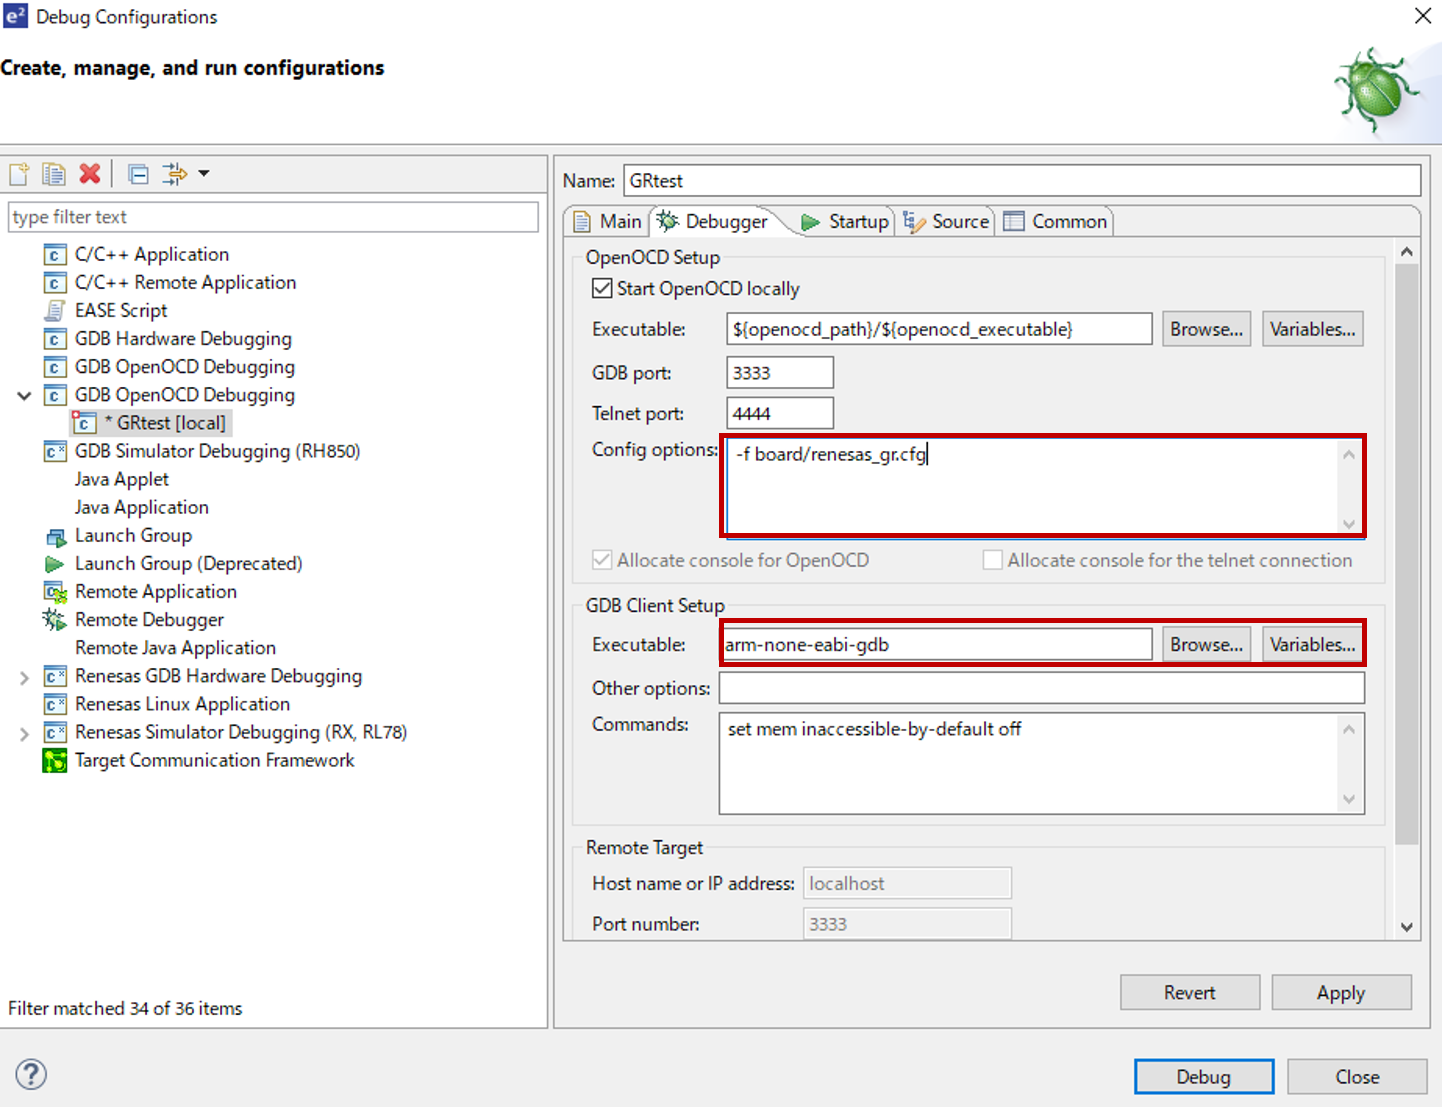
- In the [Startup] tab, uncheck "Initial Reset" and "Enable ARM semihosting".
Uncheck "Load executable" in the Load Symbols and Executable part.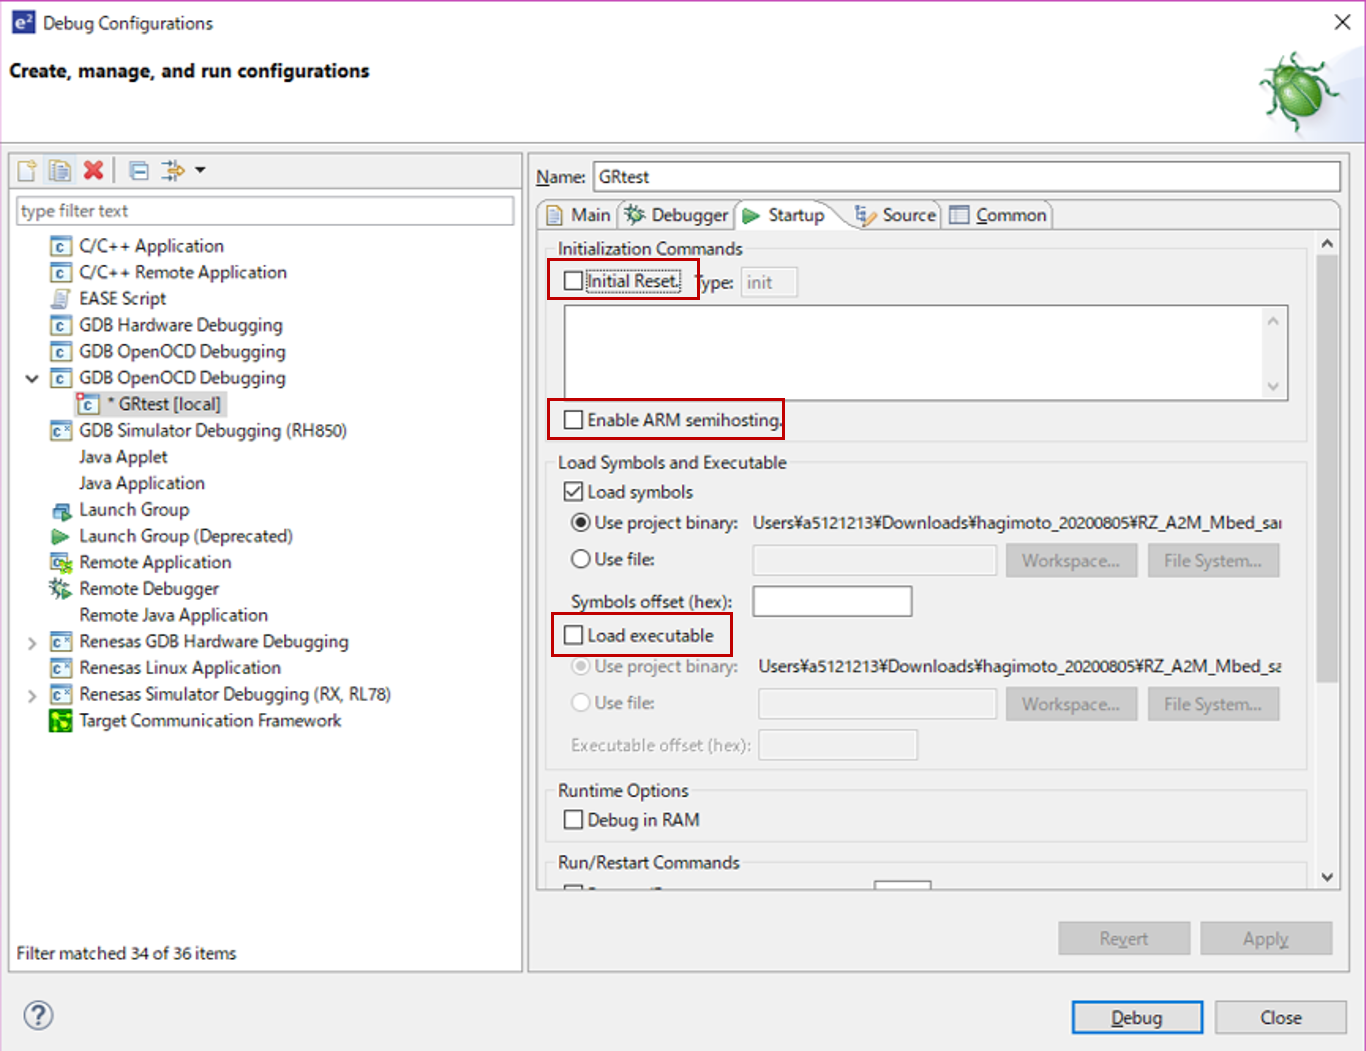
- The [Source] tab and [Common] tab are left as default.
- Click the "Apply" then click the "Debug".
- If you want to reset the debug. Select the "Debugger Console" view and enter the following command.
monitor reset halt
Please log in to post comments.
