Touch Panel of the East Rising 4.3" TFT display (ER-TFTM043-3-3280,3080,3080-3023)
Progress notes on the RA8875 touch panel driver, using the ER 4.3” TFT display with resistive touch screen option.
3/19/14 Continuing tests on the first cut of the RA8875 driver. Adjusted the sampling parameters to match a 55MHz SYSCLK for the chip (computed based on values reported by the PLL configuration register, and assuming a 20MHz crystal). The ADC clock division ratio was set to 8, to keep the ADC clock <10MHz. The ADC sample time was set to 1024 CLKs, following the pattern suggested in Table 7-20 of the RA8875 data sheet.
The touch panel continues to give “noisy” results. The initial test program displayed the x and y coordinates on the screen using a printf statement. It was possible to see that these values were roughly stable while a stylus was held against the screen to generate continuous data. However, the final value left on the screen when the stylus was removed would often differ quite a bit from the stable values seen beforehand.
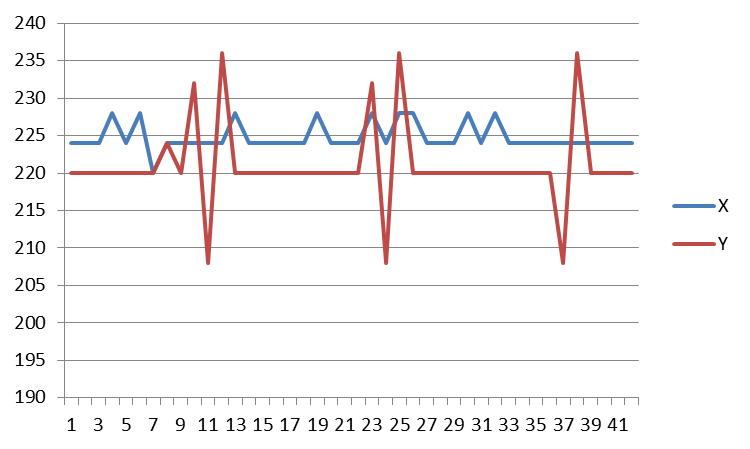
So a test program was made that sends data to the pc terminal where it could be captured and graphed. This showed some less-than-ideal behavior. The RA8875 seems to report position with a resolution of 4 counts. [Edit: only if the data is truncated from 10 bits to 8 bits, as was the case in my initial exeriments. Otherwise, full resolution is available.] So the normal ADC dither should produce a 4-count variance in the position data. This is pretty much true for the x signal, but the y signal shows the effect of a regular disturbance that causes a variance of something like +16 to -12 counts. The chart shown in Figure 1, taken from the middle of the data stream, shows the behavior:

Figure 1 - Steady state behavior
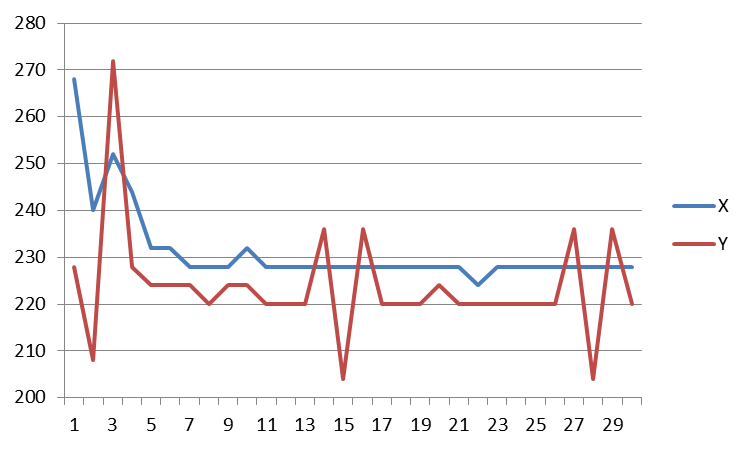
The transient behavior of the screen is shown in the second chart, Figure 2. This shows how the resistive touch panel takes some time to come to equilibrium when pressure is applied. With the parameters used for this test, the settling time was about 4-5 reporting intervals. I suspect that similar behavior occurs when pressure is released, and that that accounts for the difference between final reported values and the “stable” values, as mentioned at the outset.

Figure 2 - Initial transient
The immediate conclusion is that some software noise filtering would be useful.
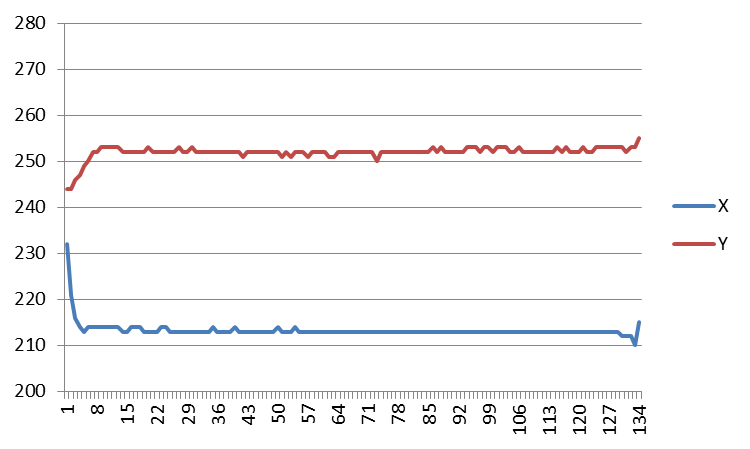
UPDATE: 21 Mar 2014 The filtering method described in an Analog Devices "Analog Dialogue" article (Volume 44, Feb 2010) was applied with good results, as can be seen in Figure 3. This graph was generated with the driver reporting the full 10-bit position resolution. Steady state variance is now about +/- 1 count, as expected. The effect of pressure changes when the stylus is first applied can be clearly seen at the leading edge; a similar effect happens at the trailing edge although it is less pronounced in this sample of data.

Figure 3 - Filtered output from the touch panel driver
Please log in to post comments.
