IoT Enabled Water Level Monitoring for stored Rainwater
This project is done by Cipriani Alex Cornilla, Angad Daryani, and Jules Henry
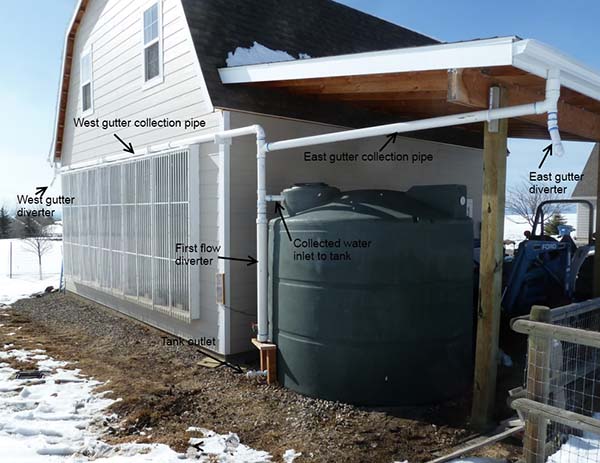
Image Source: https://morningchores.com/rainwater-harvesting/
Background
With an increased emphasis on climate change, the ability to utilise rainwater in urban environments is of essence. While many speculate that the rain in cities is acidic, the collected water can be filtered to remove impurities, and then be utilised for the purpose of cleaning outdoor surfaces - especially vehicles. It is estimated that people in developing countries use up to four liters of water to wash a single vehicle, every day. Moreover, with additional low cost opportunities to make your own rainwater harvesting system (https://morningchores.com/rainwater-harvesting/), we wanted to use the learnings from our ECE 4180 Class at Georgia Tech, to increase the intelligence of these systems and motivate more people to use rainwater.
Our Project
Given that this project was carried out in Spring 2020, during lockdown imposed for the coronavirus pandemic, we had limited resources to design, build, and test our system. Ideally, we would use a quad bilateral switch as the one mentioned in the diagram below, and then instead of LEDs, feed those pins as inputs to digital pins on our mBed. However, since we did not have access to these raw components during quarantine, we chose to use an ultrasonic sensor for water level measurement
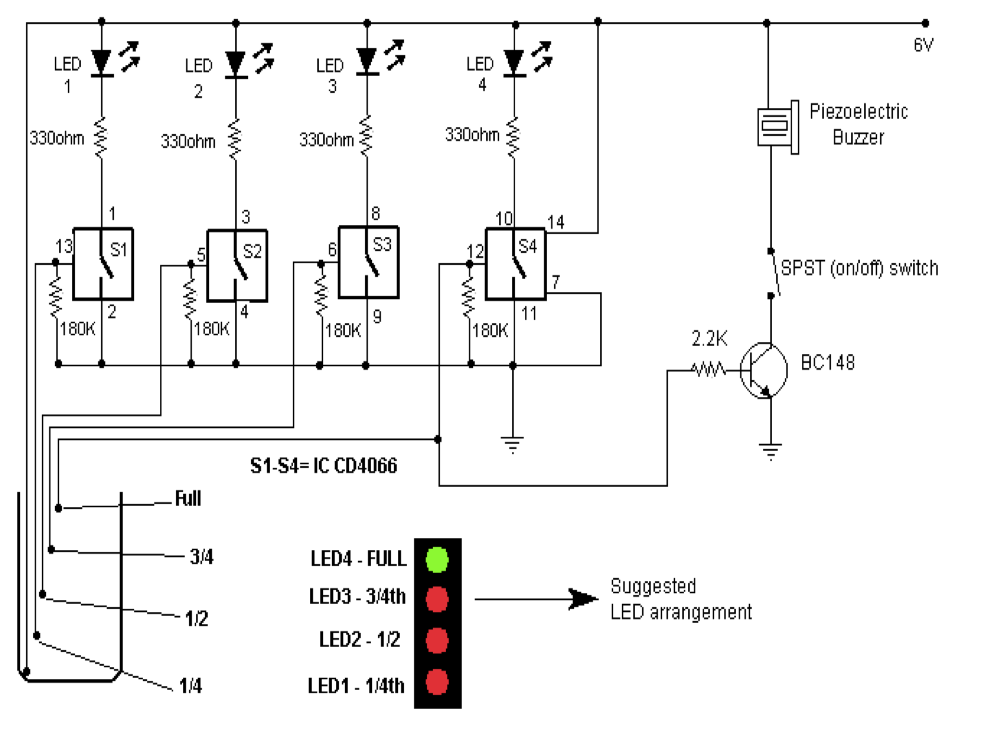
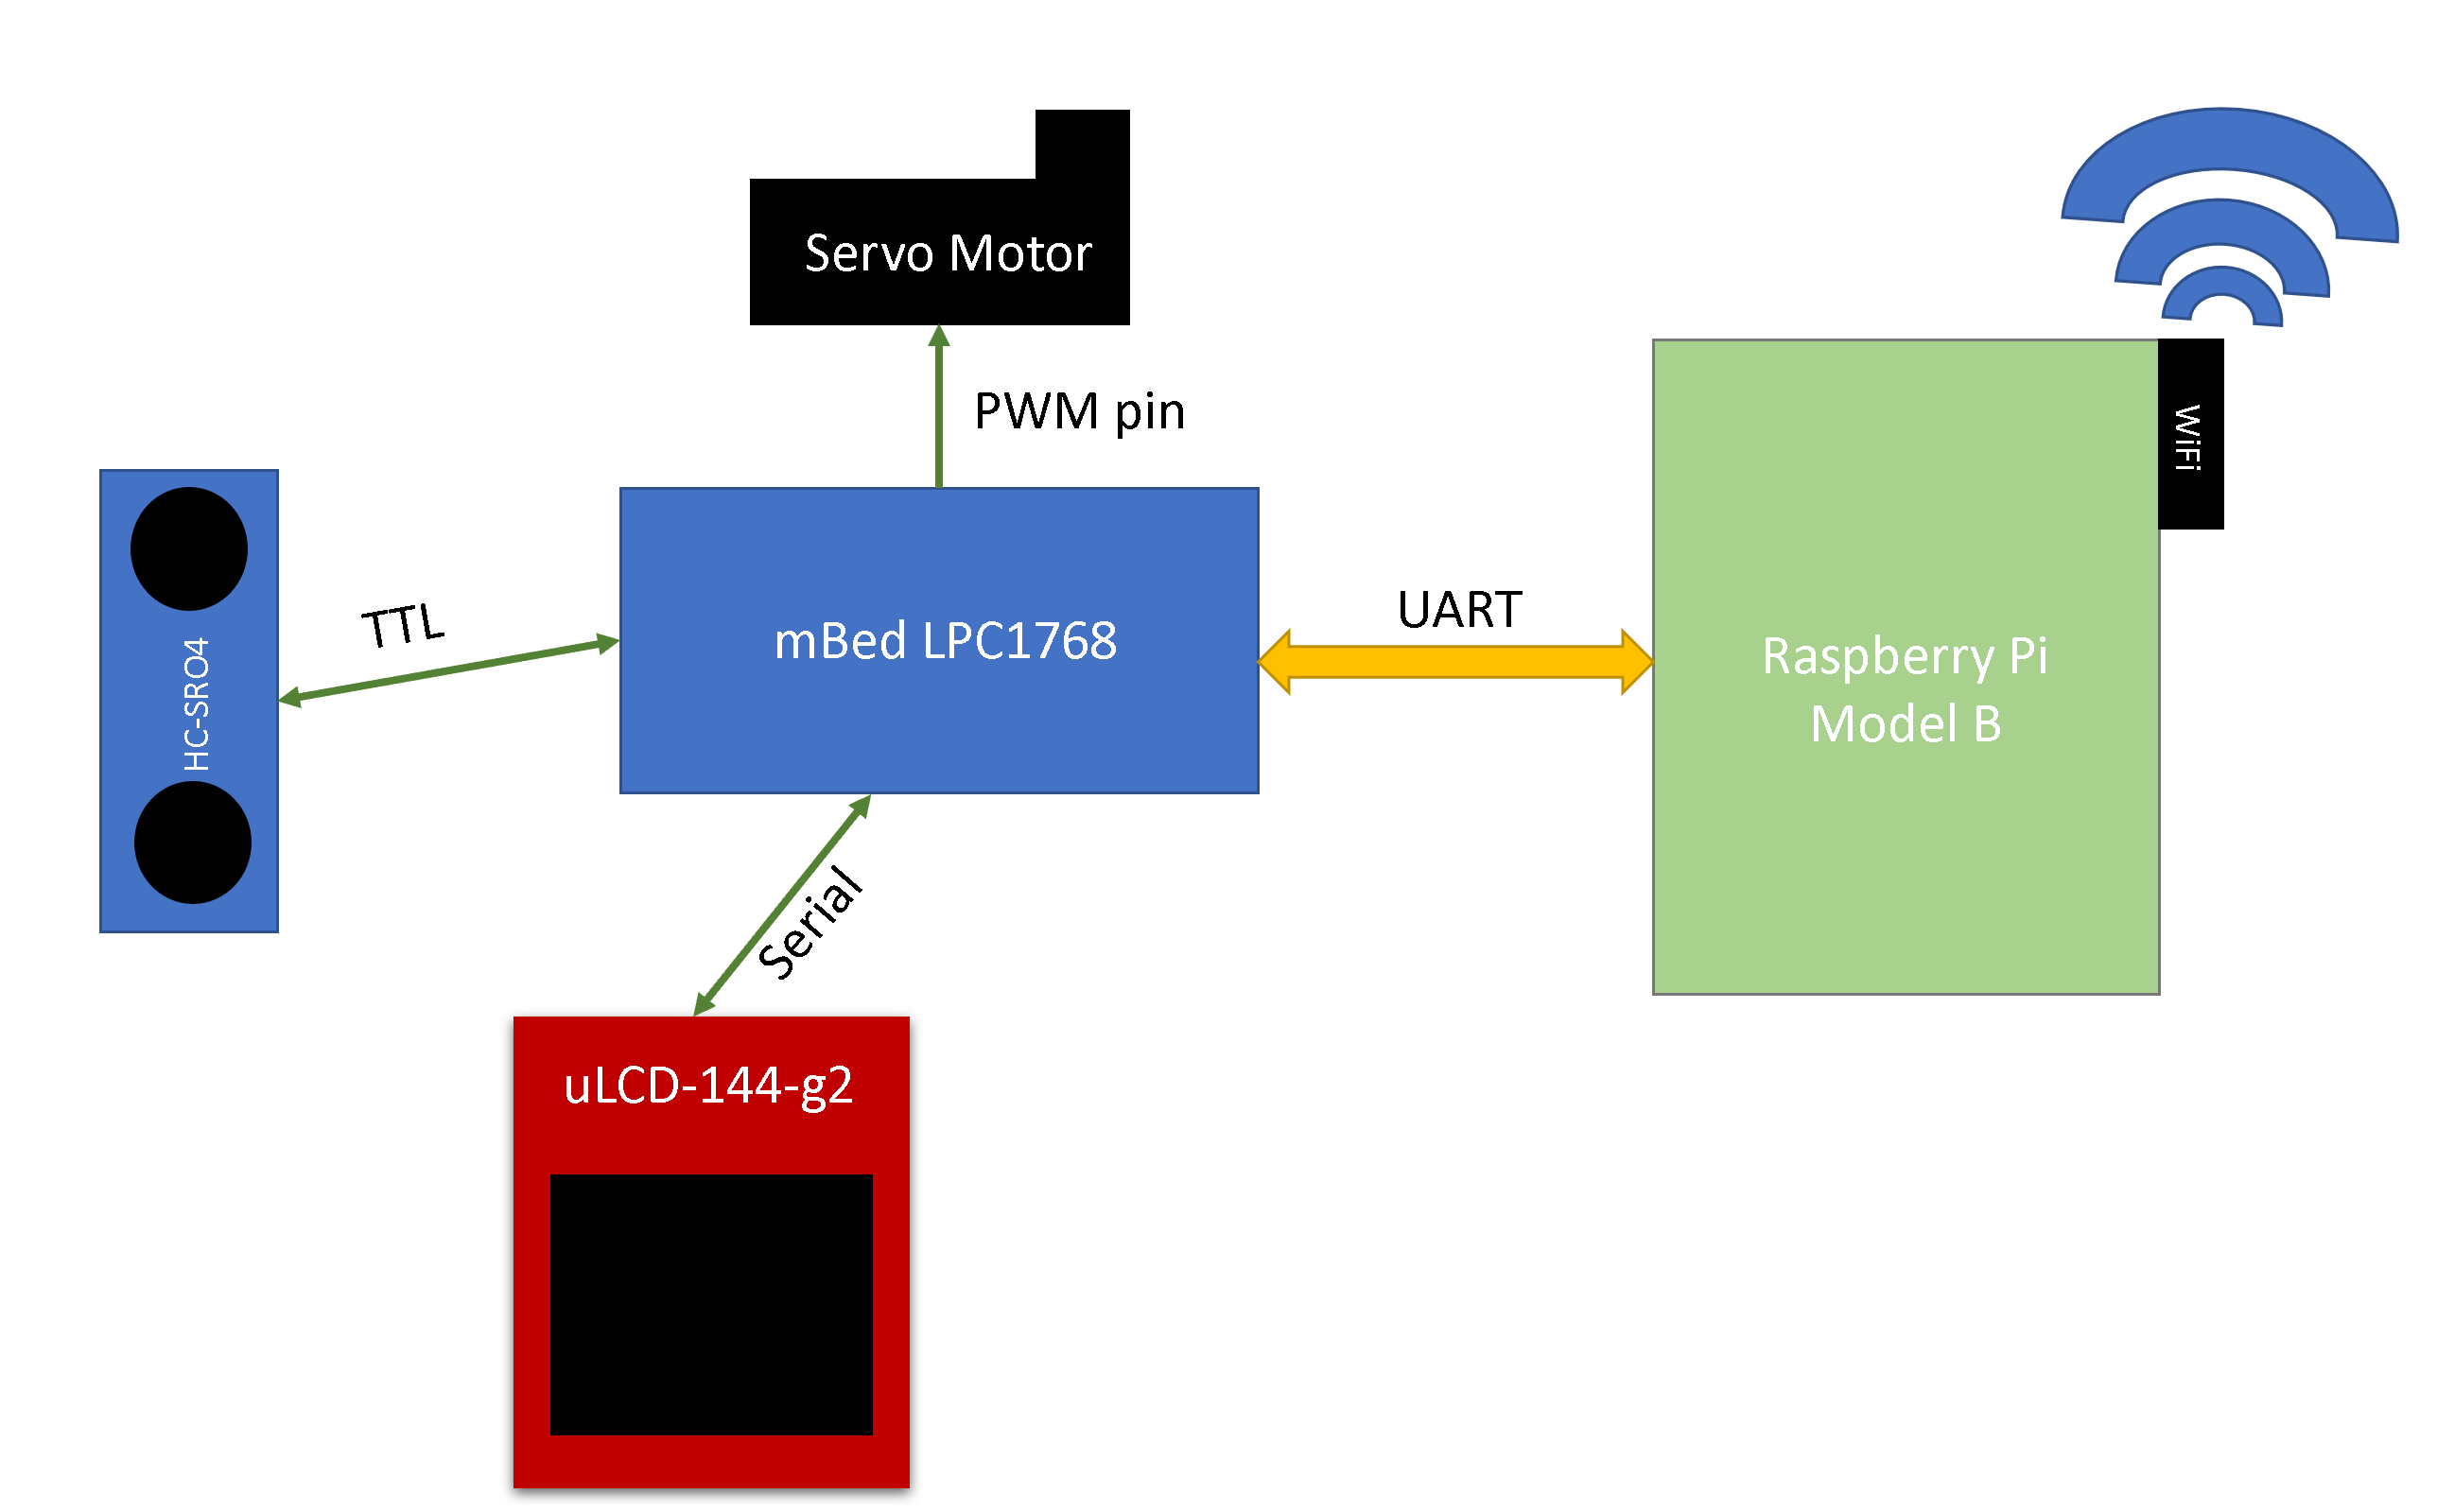
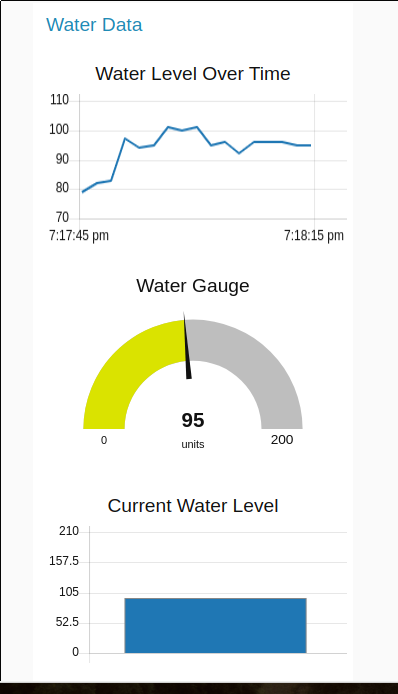
Further, since none of the members had a wifi module available at home, we decided to send information from the microcontroller over virtual serial port to a raspberry pi, which was connected to the internet. That data was pulled to the internet using node.js and specific toolkits were used to visualise the data.
Hence for the final project, we used the mBed LPC1768 microcontroller platform, a ULCD-144-G2, a DC servo motor, an HC-SR04 Ultrasonic distance sensor, and a Raspberry pi model B for this project.
High Level System Diagram
Hardware Connections
Components Utilised:
- mBed LPC1768 microcontroller
- ULCD-144-G2
- DC servo motor
- HC-SR04 Ultrasonic distance sensor
- Raspberry pi model B
uLCD -144-G2
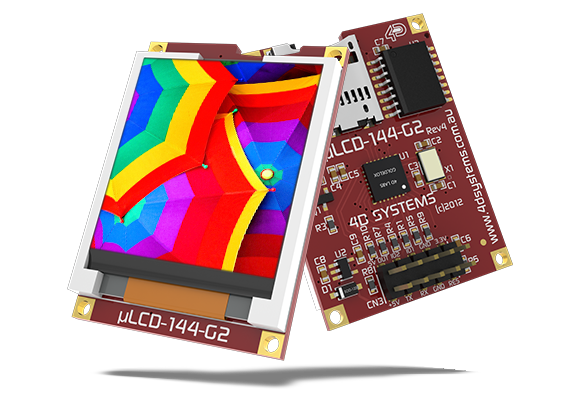
| mbed | uLCD Header | uLCD Cable |
| 5V = VU | 5V | 5V |
| GND | GND | GND |
| TX = P28 | RX | TX |
| RX = P27 | TX | RX |
| P30 | RESET | RESET |
DC Servo Motor
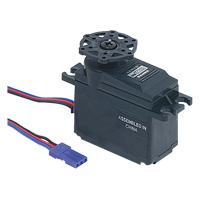
| mbed | Servo motor | Comments |
| 5V = VU | RED | It is advisable to use an external 5V power supply instead of VU |
| GND | GND | Common/External GND |
| P21 | PWM | mBed Pin |
HC-SR04 Ultrasonic distance sensor
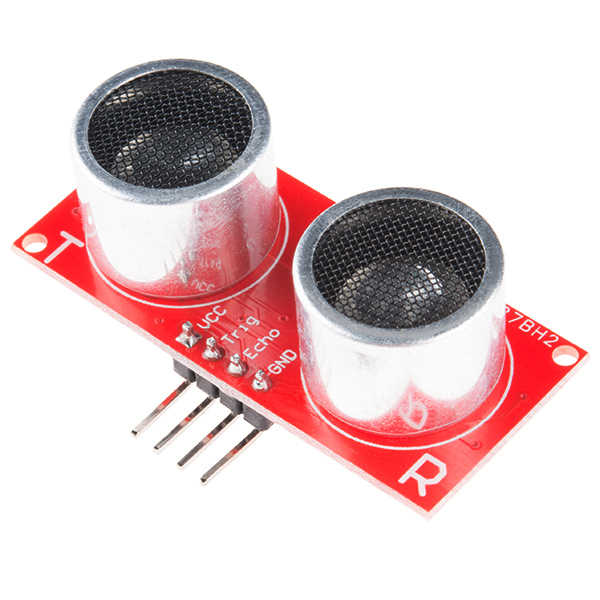
| mbed | HC-SR04 |
| VU (5V) | VCC |
| GND | GND |
| P6 | TRIG |
| P7 | ECHO |
The mBed was connected to the Raspberry Pi over USB.
Assembled Device
We used a tin can to simulate our water storage tank, and some cardboard to build a lid, which would be closed by the servo when the water values were at maximum.
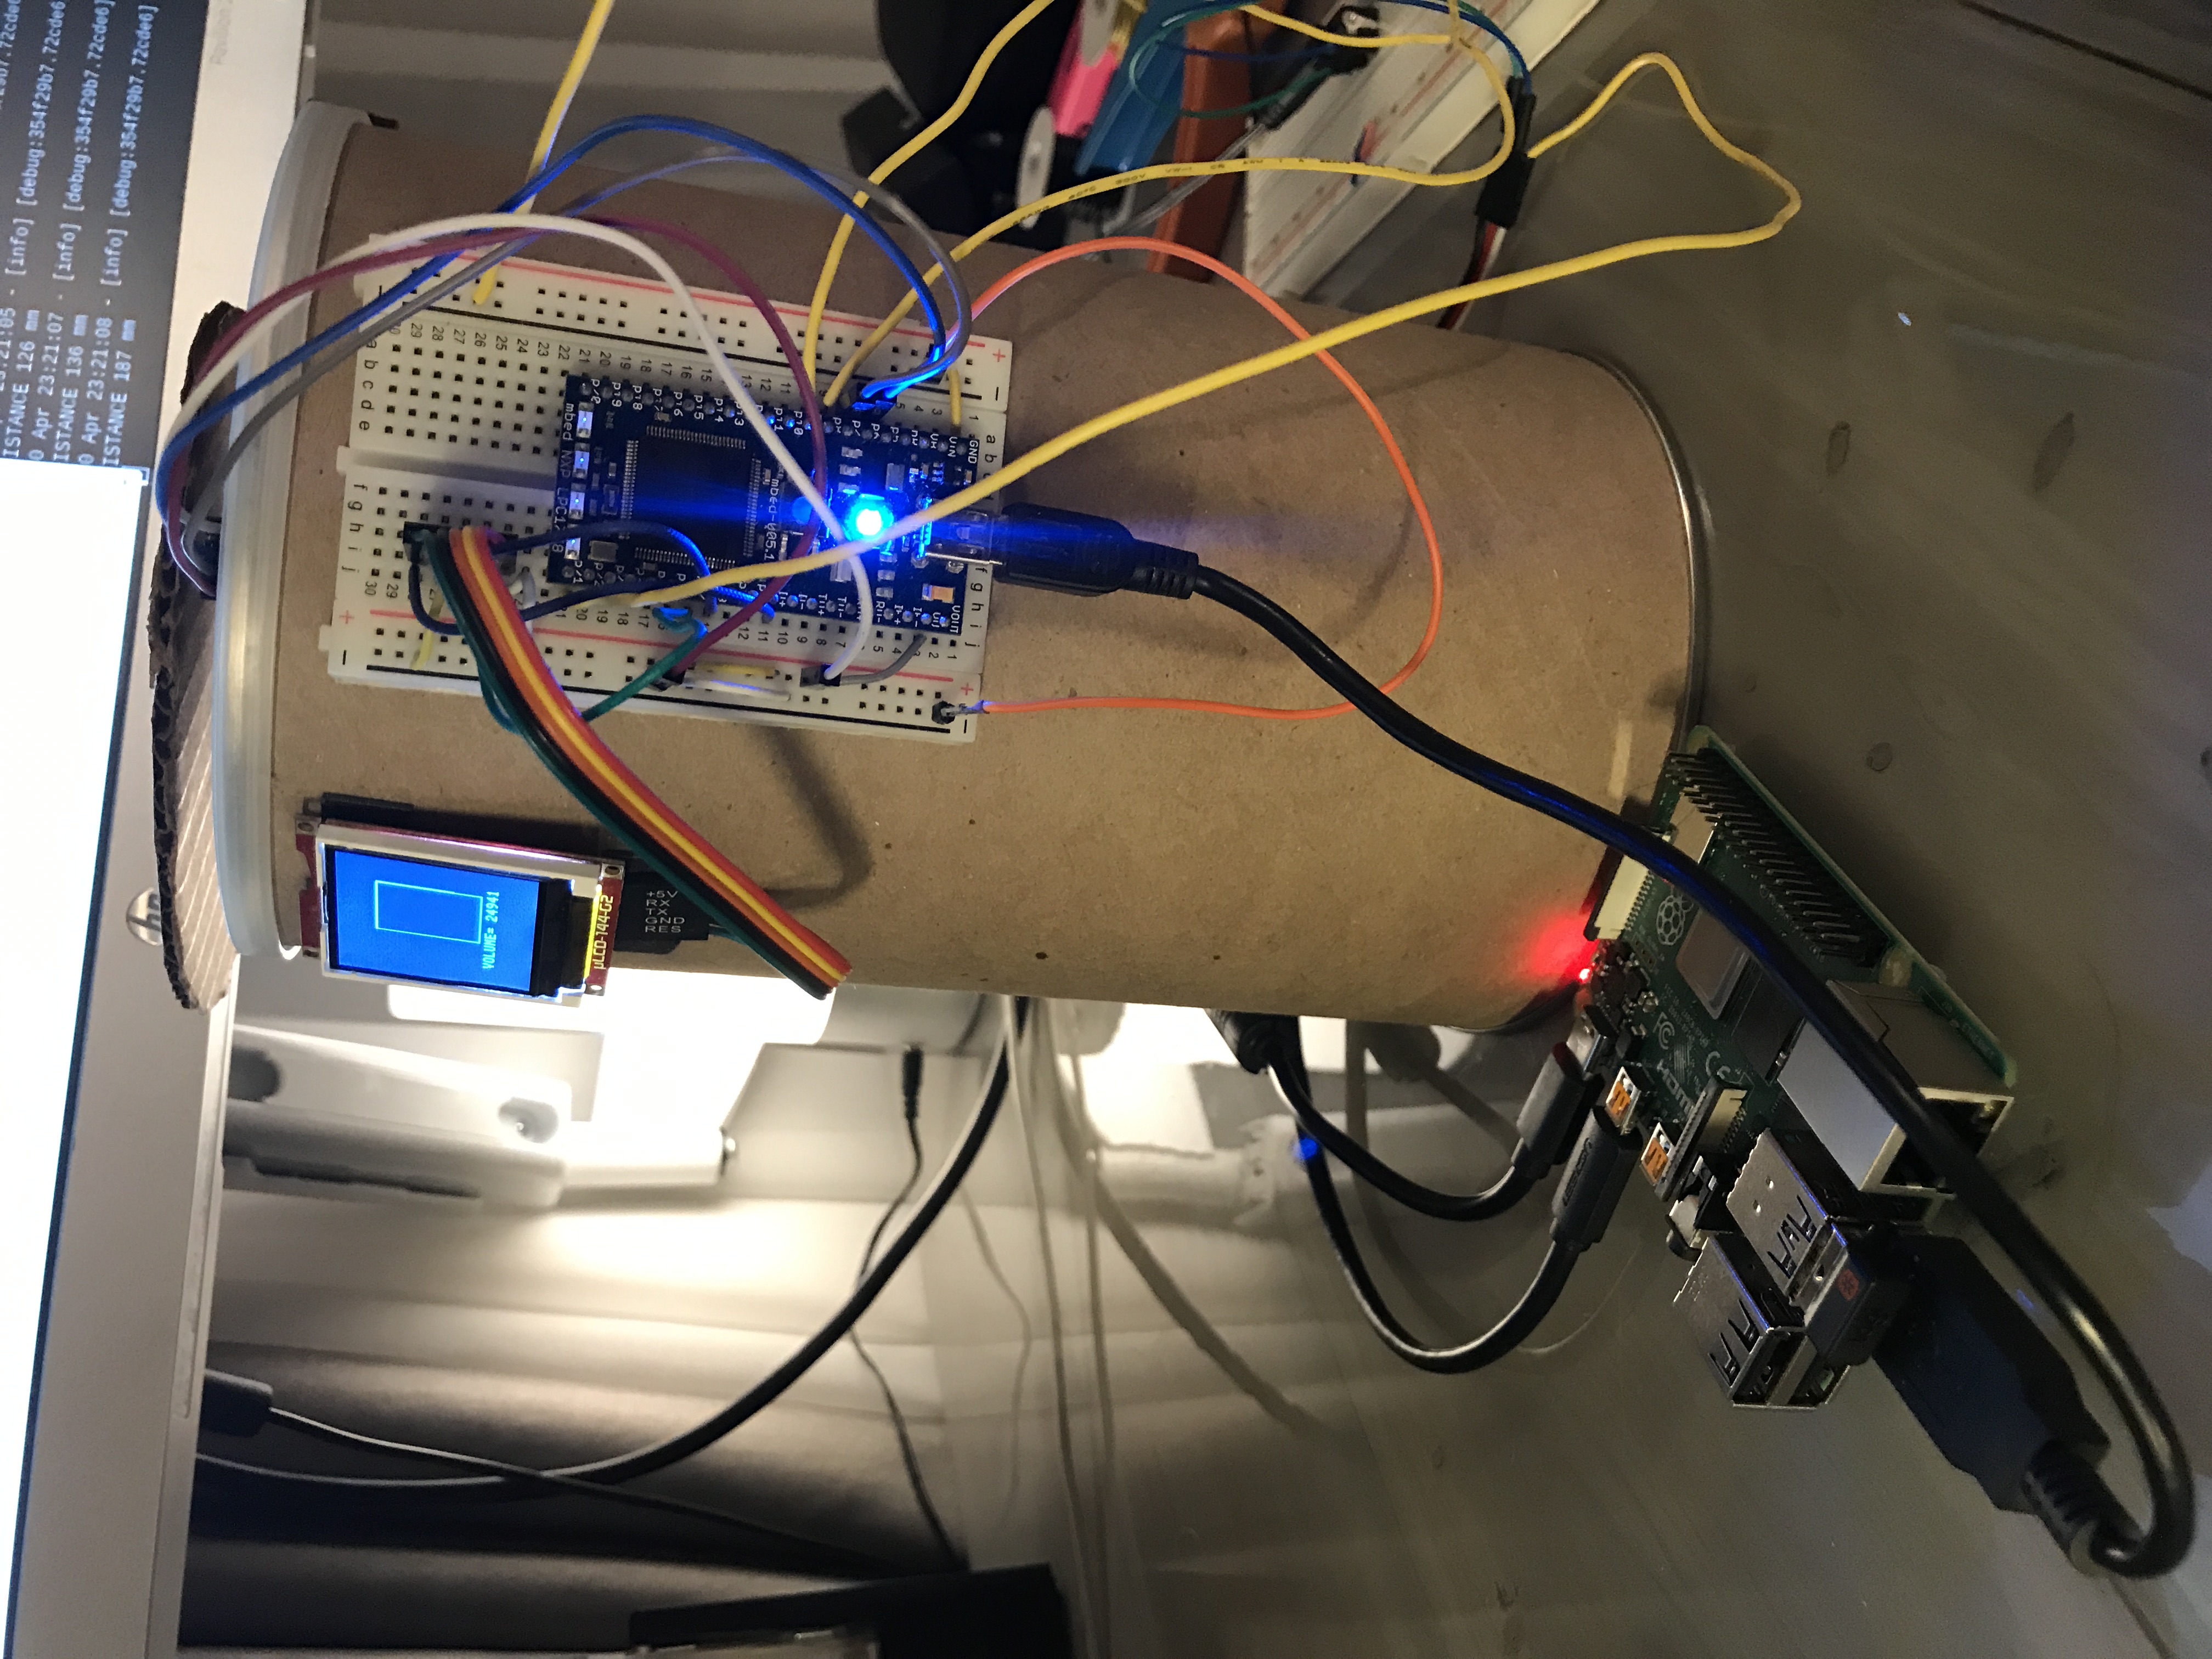
We can see in this image that the graphic LCD displays the water level and volume number.
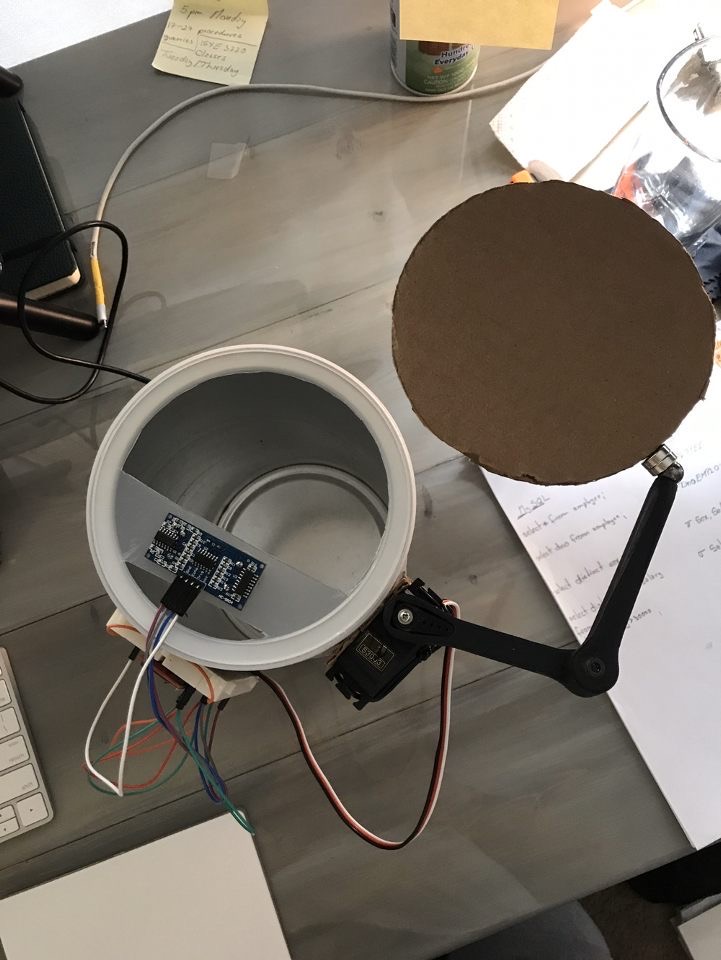
Here, we can see the assembly for the servo motor and the lid which would open and close.
mBed Code
main.cpp
/*
ECE 4180 Final Project: Rainwater Harvesting System with IoT

SAMPLE DATA: There's a lot of noise specially in the beginning when water just bounces around the empty tank
reading the sensor at longer intervals of time might help reduce the noise but the data in general looks like
this with bounds (~empty : ~full) => (~192mm : ~ 34mm)
*/
//adding the libraries
    #include "mbed.h"
    #include "ultrasonic.h"
    #include "uLCD_4DGL.h"
    #include "Servo.h"
    #include "DebounceIn.h"
//defining the pinouts
uLCD_4DGL uLCD(p28,p27,p30); // serial tx, serial rx, reset pin;
//I2C rangefinder(p9, p10); //sda, sc1
Serial pc(USBTX, USBRX); //tx, rx
Servo myservo(p21);

//defining arbitrary variables
int height;
bool LidClosed = false;
bool lid;
float p = 0;


//reads sonar data truggered when changes occur
void dist(int distance)
 {
        height = distance;
        //height = mu.getCurrentDistance(void);
        printf("DISTANCE %d mm\r\n", distance);

 }
 //sensor obj
ultrasonic mu(p6, p7, .5, 1, &dist);

 //pass on the height read by sensor return volume
int Volume(int h)
 {
   double pi = 3.14;
   double radius = 6.5;
   return(pi*radius*radius*h);
 }


 //Displays the water level and volume on LCD
 void Display()
 {
    int V = height/3;
    volatile int level = 27 + V;
    uLCD.baudrate(BAUD_3000000);
    uLCD.background_color(BLACK);
    uLCD.cls();//replace with a black retangle instead of clearing screen
    uLCD.filled_rectangle(52, 25, 100, 90, 0x000000);
    uLCD.locate(3,12);
    uLCD.printf("VOLUME= %d",Volume(height)); //get current vol and display it
    //uLCD.locate(1,1);
    uLCD.rectangle(50, 25, 102, 92, 0x0FFFFF);
    // dynamic rectangle size -> second argument of rectangle should be based on the sonar reading level.
    uLCD.filled_rectangle(52, level, 100, 90, 0x00FF00); // fill rectangle based on current volume levels
    wait(0.5);
 }

//operates the servo opens/closes the lid of the tank
void tankLid()
{
 //check is lid is triggered and closed is then open
     if(( lid == 1) && (LidClosed == true))
      {
        for(p=0; p<=10; p++)
        {
         myservo = p/10.0;

        }
        LidClosed = false;

      }
     else if((lid == 0) &&(LidClosed == false))
      {
        for(p=10; p>=0; p--)
         {
           myservo = p/10.0;

         }
         LidClosed = true;
      }
 }

   int main()
   {
    //get updates from sonar obj
    mu.startUpdates();

     while (1)
     {

        mu.checkDistance();   //checks height value fro sonar
        //height = mu.getCurrentDistance();
        Display(); //computes volume and display volume level nd value
         wait(0.5);
        //stream current level value to SDcard repeat
         //pc.printf("DISTANCE %d mm\r\n", height);//
          //tank empty == 1 and notified  open lid
         if(lid)
         {
             tankLid(); // open lid if triggered
         }

     }

  }
NODE.JS
We used Node RED to Visually Display Sensor Data
Installation Using Raspberry Pi or Debian based operating system with node.js and Node RED installed, the proper flows for this project need to be installed through terminal.
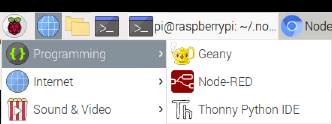
Running Locally Start Node RED from the programming section in the Pi operating system.
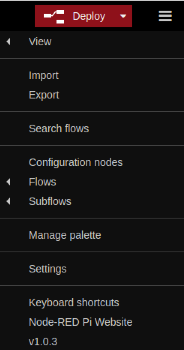
It was important to ensure the needed nodes are installed by going into the Node RED menu icon and selecting the Manage palette option.
The nodes needed for the project were:
- Function
- Delay
- Debug
- Serial In
- Gauge
- Chart
Most nodes listed above are installed by default, but the Gauge and Chart nodes are found in the node-red-dashboard package.
Once installed they should be configured as follows:
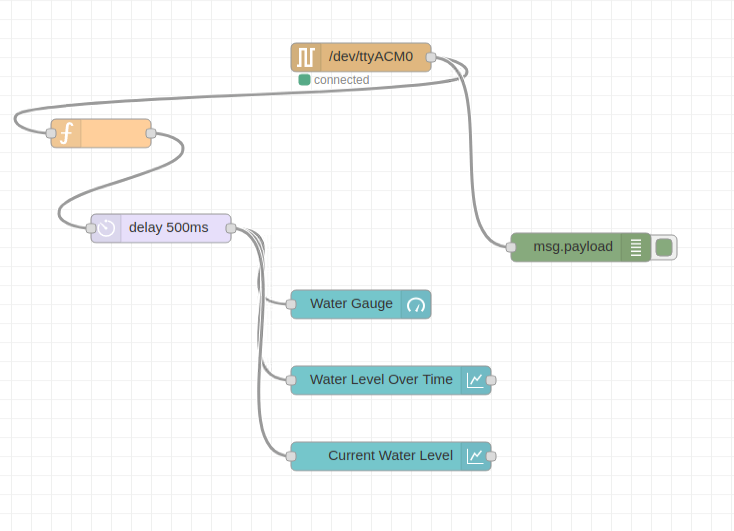
Next the mbed needed to be connected to the Pi so that it could send sonar sensor values to be displayed by the charts. This was done through the virtual com serial port by plugging the MBED into one of the Pis USB ports. After that, we used the serial in node and defined the path to the MBED (/dev/ttyACM0).
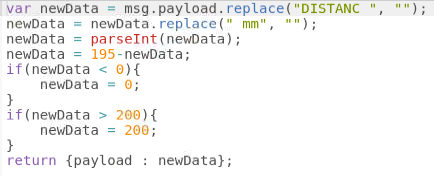
After the MBED was communicating with the Pi, we needed to parse the data (text) into usable data for the charts (int). To do this we used the function node to write some javascript code which stripped the string characters and whitespaces from the incoming data, and converted the numbers to usable integers.
After these steps, we were able to organise the charts to form a presentable UI to display water level information
Final Demo Video
Improving this device
What did not work out
- We initially tried to add a data logging system with an SD Card. In order to run this, we used multi-threading with RTOS and had to implement MUTEX in order to ensure that there was no choking over serial communication. However, this program failed to execute probably due to memory overuse.
- Since the water can be moving from side to side, there was tremendous noise added to the sonar values which made it fluctuate even when the water level was the same. Hence implementing the quad bilateral switch based water level detector would be more useful
What can be added
- Implement water level detection with quad bilateral switch circuit
- Use a wifi/cellular module instead of a raspberry pi
- Datalog all the information over the cloud with real-time-clock information
- Store all the data on online database
- Once enough information is collected, Implement basic trend analysis/machine learning to understand the clients water consumption levels
- Implement a better overflow prevention mechanism
This project was done as part of a group for the ECE 4180 Class in Spring 2020 at Georgia Tech under Professor James Hamblen.
1 comment on IoT Enabled Water Level Monitoring for stored Rainwater:
Please log in to post comments.

