Tutorial on debugging SPI with numerical scope
This tutorial explain how to debug SPI message exchanges using a numerical scope (refer to http://en.wikipedia.org/wiki/Serial_Peripheral_Interface_Bus for more details on this protocol). It follows the previous one ('how to debug I2C master/slave exchange').
1. Software configuration
- Use a GPIO associated to /CS (master mode) to trigger the beginning of the SPI read/write operation.
- The SPI operation to debug (write and read) is placed into a single call to the method SPI::write()
2. Probes assignment
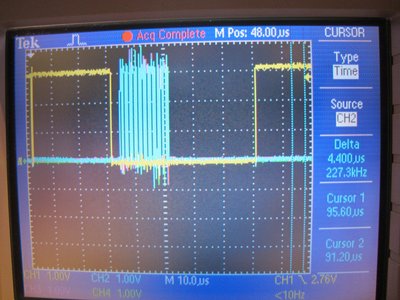
- CH1: On /CS trigger (Yellow signal)
- CH2: On SCK line (blue signal)
- CH3: On SDO line (pink signal)
- CH4: On SDI line (green signal)
The screenshot below shows a SPI frame sent to a Microchip Digital Potentiometer. The 4 scope channels are used. As expected in a such architecture (mbed as master), SDI line is not used,

3. Scope settings
- All channels are set on 1V/div in 3.3V power supply (or 2V/div in 5V power supply),
- Time base is set on 10 us/div,
- The horizontal trigger threshold level is set on the left position,
- Triggering is set on CH1, in sample mode, on falling edge, level is set to 50%
4. Signal acquisition
- Launch the application in debug mode
- Captured signals shall be displayed by the scope
- Press on Single Seq to capture one SPI frame
- Reduce the time base around 2.5us/dev to visualize different part of the SPI frame:
- External trigger (/CS) is set to 0 to enable the slave, because of mode (0,0) (Yellow signal)
- The clock is started when data is written into the SPI buffer (see NXP datasheet LPC1769/68/67/66/65/64/63, Clause 7.17 SPI serial I/O controller)
- External trigger (/CS) is set to 1 to enable the slave (Yellow signal)
5. Frame analyzing
- Activate Cursor functionality on CH2 (SCK line/blue signal)
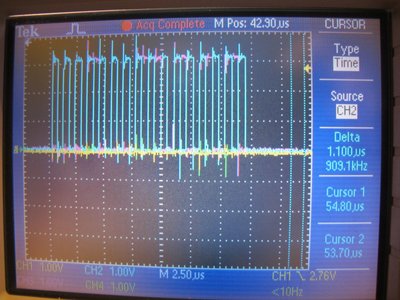
- Verify the SCK frequency. In this case study, it should be around 1MHz
- Place the cursor to each SCKhigh level and read the SDI value (pink signal)
- Compare capture timing diagram with expected timing diagram from SPI IC datasheet
The screenshot below shows the SPI frame with the time base set to around 2.5us/dev,

3 comments on Tutorial on debugging SPI with numerical scope:
Please log in to post comments.


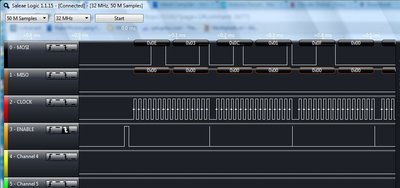
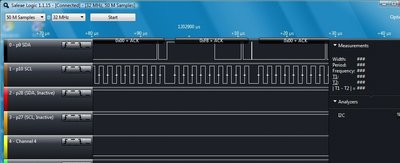
If you want to debug digital signals the logic from Saleae is a nice thing : http://www.saleae.com/logic/features
You can also decode I2C, SPI and serial protocols. The max sampling rate is 24MHz. Only fast SPI will be to fast on the mbed.