How to setup VSCode debugging for STM32 platforms
We will show you how to build and debug using Visual Studio Code (VSCode) using ST Micro's Nucleo and Discovery board.
Installation of required software
Downloading and installing VSCode
Download the installer according to the host machine to be used for installation. https://code.visualstudio.com/Download
Installing C / C ++ extension
Start VSCode. Select "Extension" from menu "Display" and install C / C ++ function extension.
Installing OpenOCD
For Mac
$ brew install openocd --enable_stlink
For Windows
http://gnutoolchains.com/arm-eabi/openocd/
Installing build tools for Mbed OS
https://github.com/armmbed/mbed-cli#installing-mbed-cli
https://github.com/armmbed/mbed-cli#quickstart-video
In the case of Windows, installation of the make utility is necessary in addition to this.
http://gnuwin32.sourceforge.net/packages/make.htm
Project setting
Create a project. Let's try importing Mbed OS sample code here.
$ mbed import mbed-os-example-blinky
Export the project for VSCode.
$ mbed export -m DISCO_L475VG_IOT01A -i vscode_gcc_arm
The above operation creates files necessary for build and debugging, so open VSCode from the same directory.
$ code.
Open .vscode / launch.json in the project file and change the following 4 places.
1. debugServerArgs
Windows:
"debugServerArgs": "-f \"C:\\Program Files (x86)\\OpenOCD-20170821\\share\\openocd\\scripts\\board\\stm32l4discovery.cfg\" -f \"C:\\Program Files (x86)\\OpenOCD-20170821\\share\\openocd\\scripts\\interface\\stlink-v2-1.cfg\" -c init -c \"reset init\"",
Mac:
"debugServerArgs": "-f /usr/local/Cellar/open-ocd/0.10.0/share/openocd/scripts/board/stm32l4discovery.cfg -f /usr/local/Cellar/open-ocd/0.10.0/share/openocd/scripts/interface/stlink-v2-1.cfg -c init -c \"reset init\"",
Information
Please select the MCU or the same series installed on the board to be used for the board configuration file specified by debugServerArgs. For Windows, put the path in double quotes.
2. serverStarted
"serverStarted": "target halted due to debug-request, current mode: Thread”,
3. MIDebuggerPath
Windows:
"MIDebuggerPath": "C:\\Program Files (x86)\\GNU Tools ARM Embedded\\5.4 2016q3\\bin\\arm-none-eabi-gdb.exe",
Mac:
"MIDebuggerPath": "/usr/local/bin/gcc-arm-none-eabi-6-2017-q1-update/bin/arm-none-eabi-gdb",
4. debugServerPath
Windows:
"debugServerPath": "C:\\Program Files (x86)\\OpenOCD-20170821\\bin\\openocd.exe",
Mac:
"debugServerPath": "/usr/local/bin/openocd"
Build and debug
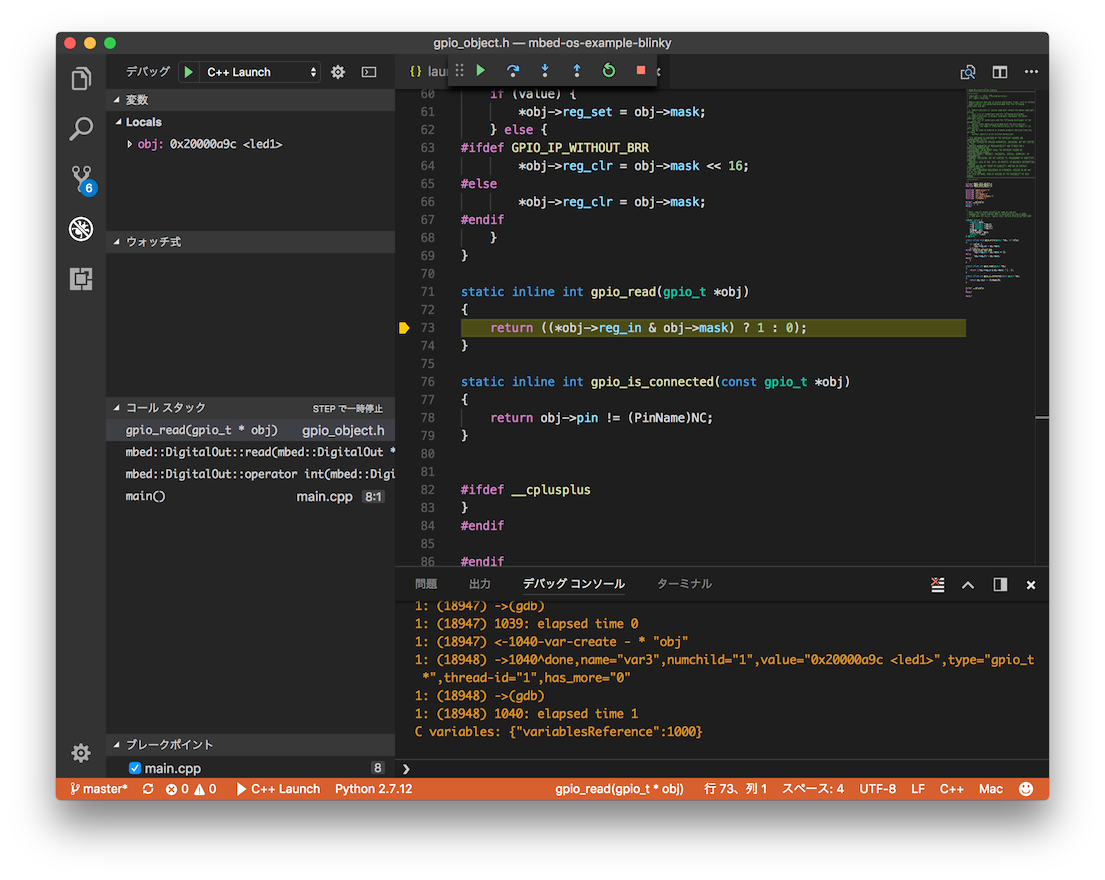
From the menu "Debug", select "Start Debugging" to start the debugging session.

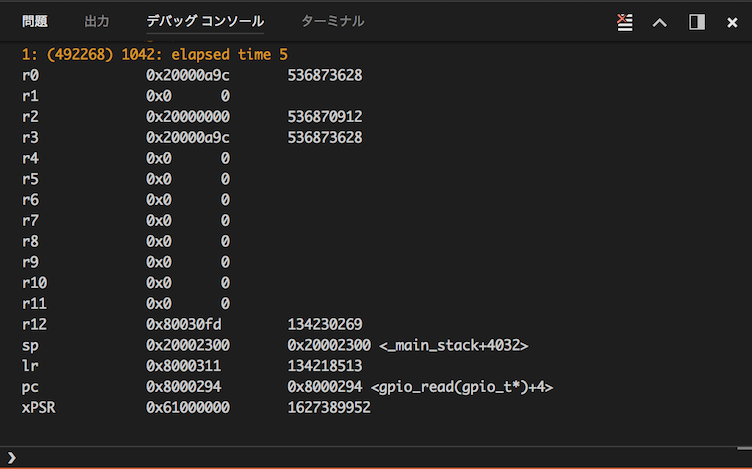
It is not possible to display general purpose registers, but it can be displayed by entering the following command from the debug console.
-exec info registers

3 comments on How to setup VSCode debugging for STM32 platforms :
Please log in to post comments.

Hi - I've imported a working blinky project for F746G-disco into VS code and set it up as per your instructions. (I've also tried various other instructions!) My problem is that whatever I do I end up with a vs code error 'Unable to start debugging. No process is associated with this object.' I'm still learning, but I have found that VScode performs MAKE ok and gives a working bin file, but wont go into debug- Hope you can give me some guidlines. Thanks. Chris Launch json: "windows": { "preLaunchTask": "make.exe", "MIMode": "gdb", "MIDebuggerPath": "C:/Program Files (x86)/GNU Tools ARM Embedded/6 2017-q2-update/bin/arm-none-eabi-gdb.exe", "debugServerPath": "C:/Program Files/GNU MCU Eclipse/OpenOCD/0.10.0-5-20171110-1117/bin/openocd.exe", "setupCommands": [ { "text": "-environment-cd ${workspaceRoot}/BUILD" }, { "text": "-target-select remote localhost:3333", "description": "connect to target", "ignoreFailures": false }, { "text": "-file-exec-and-symbols ${workspaceRoot}/build/DISCO-F746NG_blink_led.elf", "description": "load file", "ignoreFailures": false}, { "text": "-interpreter-exec console \"monitor endian little\"", "ignoreFailures": false }, { "text": "-interpreter-exec console \"monitor reset\"", "ignoreFailures": false }, { "text": "-interpreter-exec console \"monitor halt\"", "ignoreFailures": false }, { "text": "-interpreter-exec console \"monitor arm semihosting enable\"", "ignoreFailures": false }, { "text": "-target-download", "description": "flash target", "ignoreFailures": false } ] } Debug OP : (513) Starting: "C:/Program Files/GNU MCU Eclipse/OpenOCD/0.10.0-5-20171110-1117/bin/openocd.exe" -f "C:\Program Files (x86)\OpenOCD-20170821\share\openocd\scripts\board\stm32l4discovery.cfg" -f "C:\Program Files (x86)\OpenOCD-20170821\share\openocd\scripts\interface\stlink-v2-1.cfg" -c init -c "reset init" 1: (567) "C:/Program Files/GNU MCU Eclipse/OpenOCD/0.10.0-5-20171110-1117/bin/openocd.exe" exited with code 1 (0x1). 1: (576) <-logout