Important changes to forums and questions
All forums and questions are now archived. To start a new conversation or read the latest updates go to forums.mbed.com.
11 years, 5 months ago.
Keil Debug cannot trace HardFault handler
I am not expert on Cortex-M3. I recently test the memory handle using mbed LPC1768. It is strange that the debugger cannot jump into the hardfault_handler function. But the exceptional code execuated when it run in non-debug mode.
The code was exported from mbed online compiler and then opened by Keil uvision 5. I rewrite the HardFault_Handler function to capture an exception. The debugger is set as CMSIS-DAP. When I compile the code and load to the chip. It will flash LEDs after few seconds which means it jumps to the Hardfault_handler as expected. However, when I run in debug mode, the code paused at following line. The LED is not flashing as expected.
0x0000263E BEAB BKPT 0xAB
and I check the peripherals->core peripherals->fault report, the HARD_FAULT_STAT is 0x0 which means it didn't catch the interrupt. The BKPT bit as DBG_FAULT_STAT is 1. However, I didn't set any break point.
In the registers view, the ISR is 0 as well which means there is no interrupt caught!
Anyone can help on this problem? If a debugger cannot catch Hard_Fault_stat. It will be very difficult.
Here is the code. which is got from http://developer.mbed.org/users/Kemp/code/memory_test/file/883b8bc1f54a/main.cpp
main.c
 #include "mbed.h"


Serial pc(USBTX, USBRX);
BusOut leds(LED1, LED2, LED3, LED4);

extern "C" void HardFault_Handler()
{
    pc.printf("Hard fault!\r\n");
    while(1) {
        leds = 0x09;
        wait(0.1);
        leds = 0x06;
        wait(0.1);
    }
}


void fail()
{
    pc.printf("Caught the failure\r\n");
    while(1) {
        leds = 0x09;
        wait(0.4);
        leds = 0x06;
        wait(0.4);
    }
}


class Test
{
    public:
        int something;
        char woot[28];
};


int main() {
    Test *dummy;
    int index = 0;

    while(1) {
        dummy = new Test;
        if (dummy == NULL) fail();
        pc.printf("%u\r\n", index);
        ++index;
    }
}
1 Answer
11 years, 5 months ago.
The BKPT 0xAB instruction on which you are halting is a semi-host request. On the LPC1768 this would normally be intercepted by the interface chip to perform some action on behalf of the 1768. When you are debugging, this functionality is disabled in the interface chip and you end up halting in the debugger instead.
Have you tried dumping the callstack and seeing where you are when this occurs? I would think that you will see a semi-host call like semihost_exit() or semihost_close() on the stack.
I suspect that if you execute some code such as the following to generate a hard fault by reading from an invalid address, you won't get stopped short by a semi-host call:
*(volatile unsigned int*)0xFFFFFFFF;
Thanks very much Adam. I had a look at the the disassembly code around the halting point. it has something like follows. It does has something like use semihosting. I also attached the project file there.
My question is: in the real situation where I don't know the error. How could I debug from this point? Should I disable semihosting?
/media/uploads/kingwinter/memory_test_uvision_lpc1768.zip
/media/uploads/kingwinter/disassemble.jpg
posted by 30 Jan 2015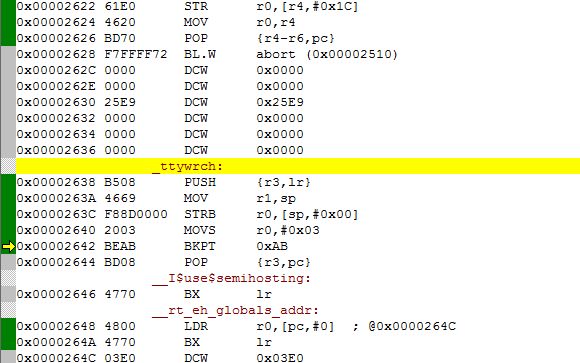