Debugging with Eclipse and pyOCD
This article explains how to debug an exported MBED project with eclipse and pyOCD. To debug a project you need to first export it from MBED as a makefile project, import the makefile project into eclipse and finally setup debugger configurations. Below are these steps but in much more detail.
Initial Setup
- Download the latest version of eclipse with CDT
- Install the GNU ARM Eclipse plugin
- Open Eclipse
- Click the Help menu item and select Install New Software
- In the Work with box paste the install address and press enter - http://sourceforge.net/projects/gnuarmeclipse/files/Eclipse/updates/
- The package GNU ARM C/C++ Cross Development Tools should appear. Select it.
- Click Next repeatedly and accept licence agreements
- Click Finish. If prompted to restart eclipse select Yes
- Install tools necessary for makefile projects:
- GCC ARM Embedded
- Windows only
- Add GCC ARM Embedded bin directory to path after installing - Ex. C:\Program Files (x86)\GNU Tools ARM Embedded\4.9 2015q2\bin
- Install make and add it to path. Make is available as one of the tools here: http://gnuwin32.sourceforge.net/
- Install python 2.7.9 or above.
- Windows Only - Make sure to select "Add to path" when installing
- Install pyOCD by running "pip install pyocd"
Importing to Eclipse and Building
- In the mbed online compiler export the project you want to debug as GCC (Arm Embedded)
- Extract the project archive exported from mbed
- Open Eclipse
- Click the File menu item, mouse over New and select Makefile Project with Existing Code
- Paste the location of your project into Existing Code Location
- Project Name should automatically populate. Update name here if desired.
- In Toolchain for Indexer Settings select Cross ARM GCC
- Click Finish to create the project
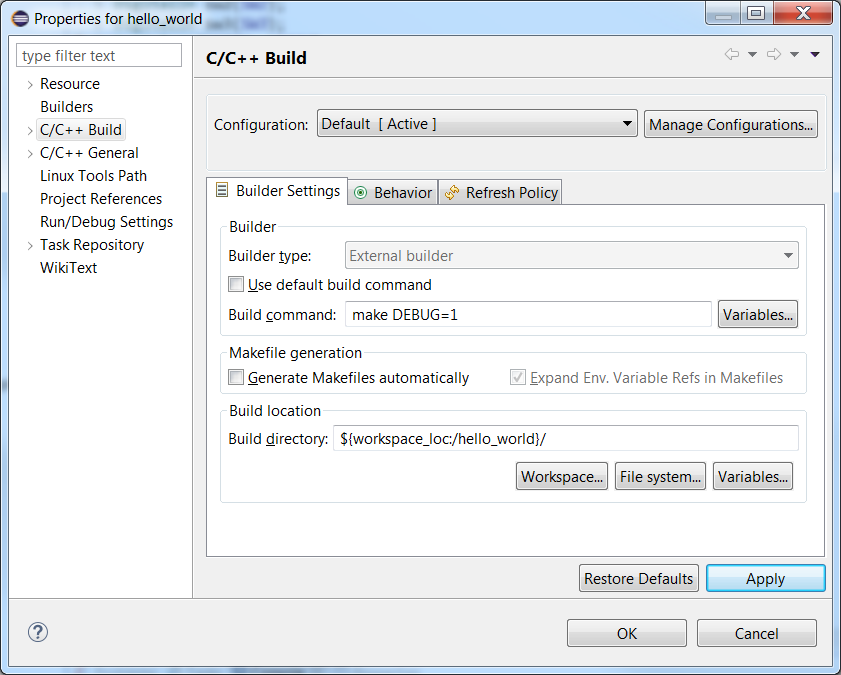
- To setup building in eclipse go to the Project menu item and select Properties
- Select C/C++ Build
- Unselect Use default build command
- For Build command enter make DEBUG=1. The option "DEBUG=1" configures the make file to build optimized code which makes debugging easier.
- Click Apply and then click OK.

- Click the build button in eclipse and verify the project builds successfully.
Setting up debug configuration
The last step before actually debugging it to setup the debug configuration. This only needs to be done once for per project. Once created the configuration can be checked into revision control, allowing anyone else working on the project to use it without needing to go through setup again.
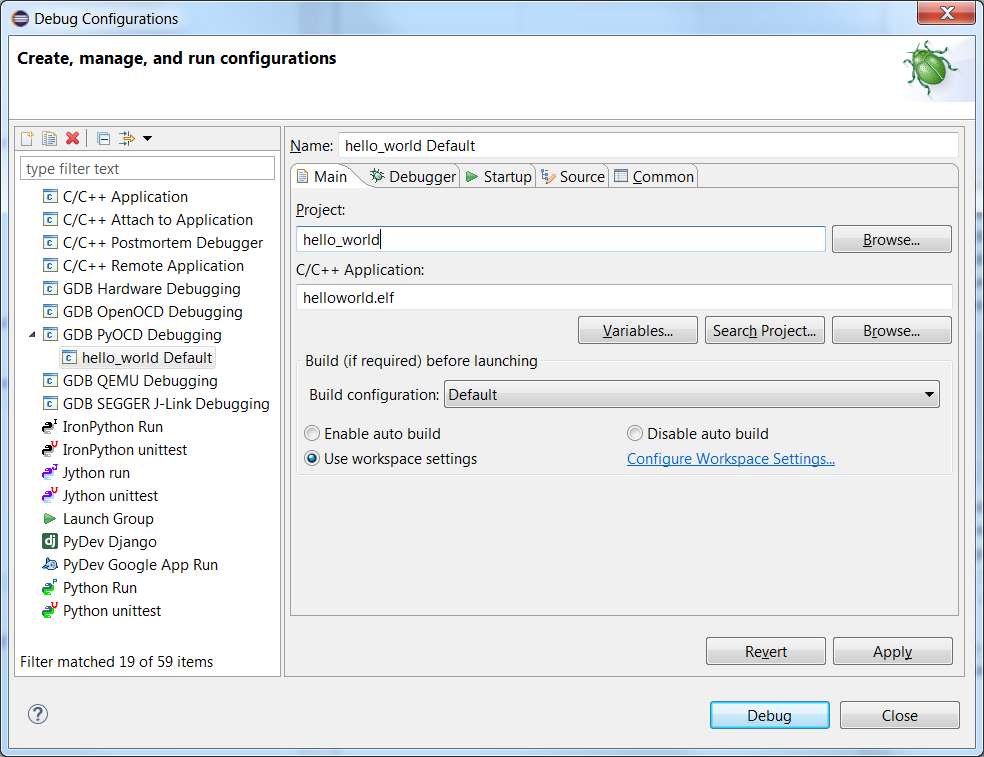
- On the Run menu item select Debug Configurations... to bring up configurations
- Right click on GDB pyOCD Debugging and select New
- Open Main tab and verify Project is correct and C/C++ Application correctly points to the .elf file.

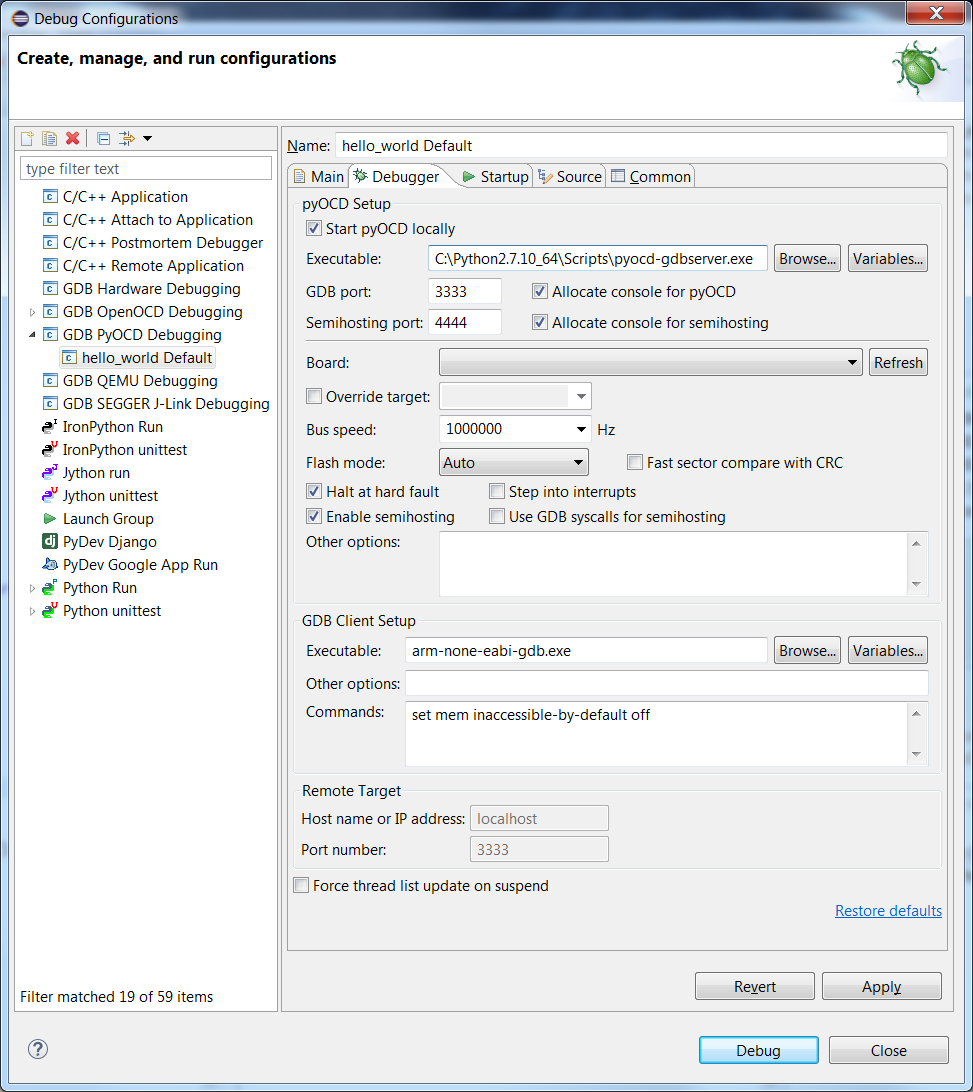
- Open Debugger tab
- In the pyOCD Setup box :
- Check Start pyOCD locally if it isn't checked already
- Set Executable: to pyocd-gdbserver or the full path to your installation.
- Set GDB port: to a free port. The default value of 3333 should work.
- In the GDB Client Setup box:
- Set Executable to arm-none-eabi-gdb.exe
- In Commands: add set mem inaccessible-by-default off if it is not present
- It should look something like this when configured:

- Defaults will work in Startup tab
- Defaults will work in Source tab
- Open Common tab
- Under Save as select Shared file. The default name will work. This allows the debug configuration to be saved locally and checked into the current project.
- In Display in favorites menu box check Debug
- In the pyOCD Setup box :
Debugging
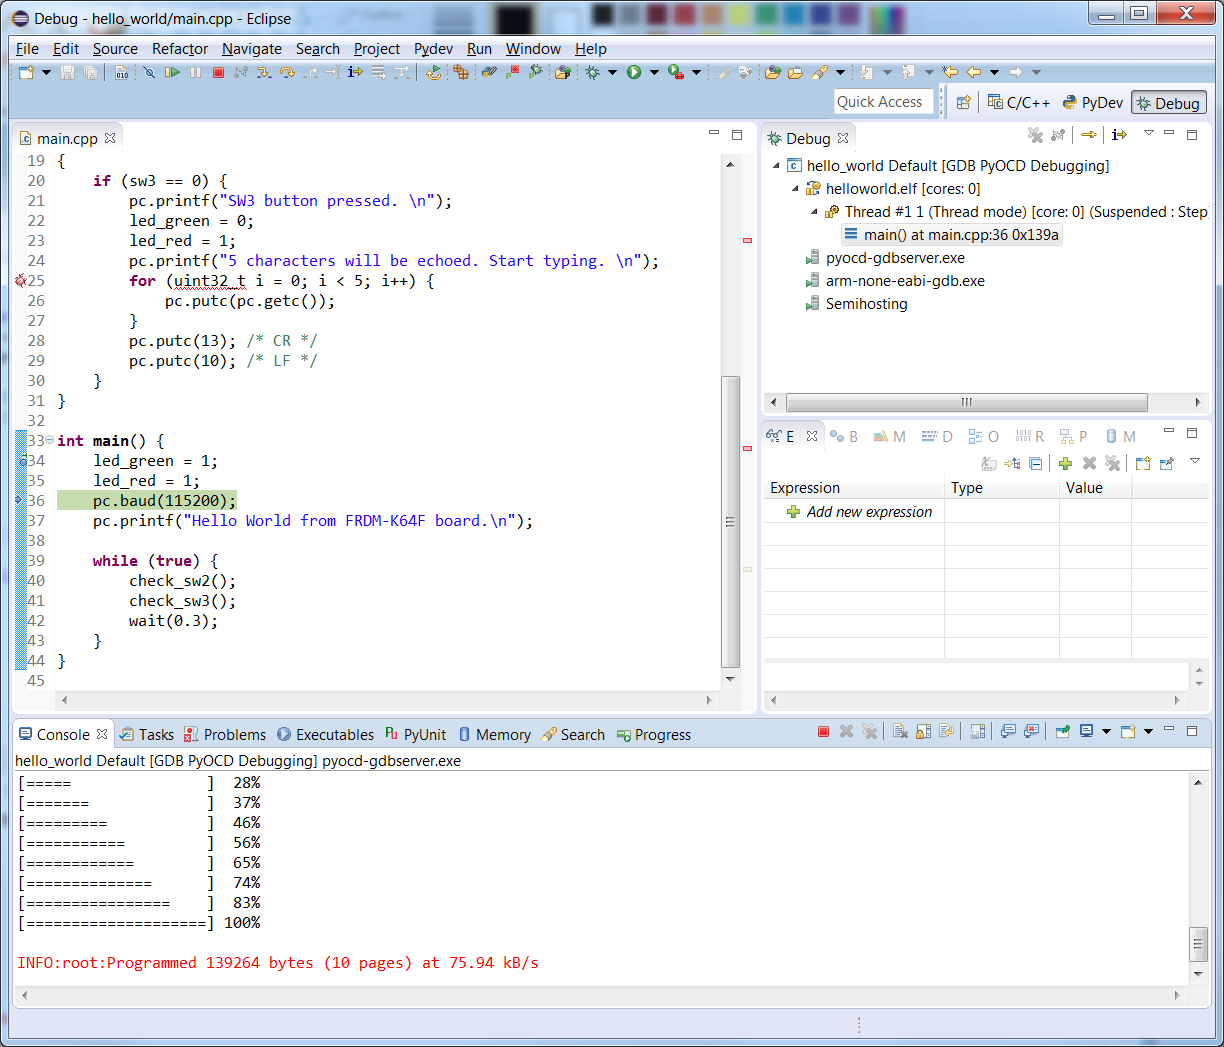
To start a debugging session open the drop-down menu next to the bug icon and select the debug configuration created earlier. This will automatically load the current program and begin a debugging session. From there you can do things like set breakpoints, set watchpoints, view registers, view disassembly, browse memory and examine the callstack.

5 comments on Debugging with Eclipse and pyOCD:
Please log in to post comments.


So when you go to the Eclipse site to install, the option is "Eclipse IDE for C/C++ Developers " , there is no mention of CDT there ?
Ah you have to actually go to http://www.eclipse.org/downloads/packages/eclipse-ide-cc-developers/neonr and then select your download...